
“Install Netdata Parent dan Child Node pada Centos/Rocky linux”
Pengantar
Netdata adalah sebuah perangkat lunak pemantauan kinerja sistem yang dirancang untuk memberikan visibilitas real-time terhadap berbagai metrik sistem dan jaringan. Netdata dapat dipasang pada sebagian besar sistem operasi dan memberikan informasi terperinci tentang penggunaan CPU, memori, disk, jaringan, serta statistik aplikasi dan layanan lainnya.
Netdata berbeda dengan banyak solusi pemantauan tradisional karena kemampuannya untuk memberikan data secara real-time dengan latensi yang sangat rendah. Ini memungkinkan pengguna untuk melihat dan menganalisis performa sistem secara mendalam dengan pembaruan yang hampir instan.
Perangkat lunak ini juga dilengkapi dengan antarmuka pengguna web yang intuitif dan dapat disesuaikan. Netdata mendukung grafik interaktif, pemberitahuan, dan integrasi dengan alat-alat lain seperti Grafana untuk visualisasi data yang lebih lanjut.
Netdata sangat berguna untuk mengawasi kesehatan sistem, mendeteksi masalah kinerja dengan cepat, dan mengoptimalkan konfigurasi untuk meningkatkan efisiensi. Hal ini berguna bagi administrator sistem, pengembang perangkat lunak, dan siapa saja yang ingin memantau dan memahami performa sistem secara real-time.
Install Netdata Parent Node
- Update OS
yum update -y

atau

dnf update -y- Install dependensi
dnf install epel-release -y- Install netdata
wget -O /tmp/netdata-kickstart.sh https://get.netdata.cloud/kickstart.sh && sh /tmp/netdata-kickstart.sh --stable-channel --disable-telemetry --static-only- Run Service
systemctl start netdata

systemctl enable netdata

systemctl status netdata- Allow Firewall
firewall-cmd --permanent --add-port=19999/tcp
firewall-cmd --reload- Cek file netdata harusnya seperti di bawah

- Edit netdata.conf
vi /opt/netdata/etc/netdata/netdata.conf
# netdata configuration
#
# You can download the latest version of this file, using:
#
# wget -O /etc/netdata/netdata.conf http://localhost:19999/netdata.conf
# or
# curl -o /etc/netdata/netdata.conf http://localhost:19999/netdata.conf
#
# You can uncomment and change any of the options below.
# The value shown in the commented settings, is the default value.
#
# global netdata configuration
[global]
run as user = netdata
web files owner = root
web files group = root
bind socket to IP = 127.0.0.1
#run as user = netdata
# glibc malloc arena max for plugins = 1
# cpu cores = 2
# libuv worker threads = 16
# hostname = netdata
# host access prefix =
# enable metric correlations = yes
# metric correlations method = ks2
# timezone = Asia/Jakarta
# OOM score = 0
# process scheduling policy = batch
# process nice level = 19
# pthread stack size = 131072
[db]
update every = 1
mode = dbengine
dbengine page descriptors in file mapped memory = yes
# dbengine page cache size MB = 32
# dbengine extent cache size MB = 0
# dbengine enable journal integrity check = no
# dbengine disk space MB = 256
dbengine multihost disk space MB = 12000
dbengine page cache size MB = 1400
# memory deduplication (ksm) = yes
# cleanup obsolete charts after secs = 3600
# gap when lost iterations above = 1
# enable replication = yes
# seconds to replicate = 86400
# seconds per replication step = 600
# cleanup orphan hosts after secs = 3600
# dbengine use direct io = yes
# dbengine pages per extent = 64
storage tiers = 3
dbengine tier 1 page cache size MB = 512
dbengine tier 1 multihost disk space MB = 4096
dbengine tier 1 update every iterations = 60
dbengine tier 1 backfill = new
dbengine tier 2 page cache size MB = 128
dbengine tier 2 multihost disk space MB = 2048
dbengine tier 2 update every iterations = 60
dbengine tier 2 backfill = new
# dbengine parallel initialization = no
# dbengine tier 1 multihost disk space MB = 128
# dbengine tier 1 update every iterations = 60
# dbengine tier 1 backfill = new
# dbengine tier 2 multihost disk space MB = 64
# dbengine tier 2 update every iterations = 60
# dbengine tier 2 backfill = new
# delete obsolete charts files = yes
# delete orphan hosts files = yes
# enable zero metrics = no
# replication threads = 1
[directories]
# config = /opt/netdata/etc/netdata
# stock config = /opt/netdata/usr/lib/netdata/conf.d
# log = /opt/netdata/var/log/netdata
# web = /opt/netdata/usr/share/netdata/web
# cache = /opt/netdata/var/cache/netdata
# lib = /opt/netdata/var/lib/netdata
# home = /root
# lock = /opt/netdata/var/lib/netdata/lock
# plugins = "/opt/netdata/usr/libexec/netdata/plugins.d" "/opt/netdata/etc/netdata/custom-plugins.d"
# registry = /opt/netdata/var/lib/netdata/registry
# stock health config = /opt/netdata/usr/lib/netdata/conf.d/health.d
# health config = /opt/netdata/etc/netdata/health.d
[logs]
# debug flags = 0x0000000000000000
# debug = /opt/netdata/var/log/netdata/debug.log
# error = /opt/netdata/var/log/netdata/error.log
# collector = /opt/netdata/var/log/netdata/collector.log
# access = /opt/netdata/var/log/netdata/access.log
# health = /opt/netdata/var/log/netdata/health.log
# facility = daemon
# errors flood protection period = 1200
# errors to trigger flood protection = 200
# severity level = info
[environment variables]
# PATH = /opt/netdata/bin:/usr/local/sbin:/usr/local/bin:/usr/sbin:/usr/bin:/sbin:/usr/sbin:/usr/local/bin:/usr/local/sbin
# PYTHONPATH =
# TZ = :/etc/localtime
[host labels]
# name = value
[sqlite]
# auto vacuum = INCREMENTAL
# synchronous = NORMAL
# journal mode = WAL
# temp store = MEMORY
# journal size limit = 16777216
# cache size = -2000
[cloud]
# conversation log = no
# proxy = env
# query thread count = 2
[ml]
# enabled = yes
# maximum num samples to train = 21600
# minimum num samples to train = 900
# train every = 10800
# number of models per dimension = 18
# delete models older than = 604800
# num samples to diff = 1
# num samples to smooth = 3
# num samples to lag = 5
# random sampling ratio = 0.20000
# maximum number of k-means iterations = 1000
# dimension anomaly score threshold = 0.99000
# host anomaly rate threshold = 1.00000
# anomaly detection grouping method = average
# anomaly detection grouping duration = 300
# num training threads = 4
# flush models batch size = 128
# dimension anomaly rate suppression window = 900
# dimension anomaly rate suppression threshold = 450
# enable statistics charts = yes
# hosts to skip from training = !*
# charts to skip from training = netdata.*
# stream anomaly detection charts = yes
[health]
# silencers file = /opt/netdata/var/lib/netdata/health.silencers.json
# enabled = yes
# is ephemeral = no
# has unstable connection = no
# run at least every seconds = 10
# postpone alarms during hibernation for seconds = 60
# default repeat warning = never
# default repeat critical = never
# in memory max health log entries = 1000
# health log history = 432000
# enabled alarms = *
# script to execute on alarm = /opt/netdata/usr/libexec/netdata/plugins.d/alarm-notify.sh
# use summary for notifications = yes
# enable stock health configuration = yes
[web]
# ssl key = /opt/netdata/etc/netdata/ssl/key.pem
# ssl certificate = /opt/netdata/etc/netdata/ssl/cert.pem
# tls version = 1.3
# tls ciphers = none
# ses max tg_des_window = 15
# des max tg_des_window = 15
# mode = static-threaded
# listen backlog = 4096
# default port = 19999
bind to = 192.168.3.30
# disconnect idle clients after seconds = 60
# timeout for first request = 60
# accept a streaming request every seconds = 0
# respect do not track policy = no
# x-frame-options response header =
# allow connections from = localhost *
# allow connections by dns = heuristic
# allow dashboard from = localhost *
# allow dashboard by dns = heuristic
# allow badges from = *
# allow badges by dns = heuristic
# allow streaming from = *
# allow streaming by dns = heuristic
# allow netdata.conf from = localhost fd* 10.* 192.168.* 172.16.* 172.17.* 172.18.* 172.19.* 172.20.* 172.21.* 172.22.* 172.23.* 172.24.* 172.25.* 172.26.* 172.27.* 172.28.* 172.29.
* 172.30.* 172.31.* UNKNOWN
# allow netdata.conf by dns = no
# allow management from = localhost
# allow management by dns = heuristic
# enable gzip compression = yes
# gzip compression strategy = default
# gzip compression level = 3
# ssl skip certificate verification = no
# web server threads = 2
# web server max sockets = 1024
[httpd]
# enabled = no
[registry]
enabled = yes
# netdata unique id file = /opt/netdata/var/lib/netdata/registry/netdata.public.unique.id
# registry db file = /opt/netdata/var/lib/netdata/registry/registry.db
# registry log file = /opt/netdata/var/lib/netdata/registry/registry-log.db
# registry save db every new entries = 1000000
# registry expire idle persons days = 365
# registry domain =
# registry to announce = http://192.168.3.30:19999
# registry hostname = netdata
# verify browser cookies support = yes
# enable cookies SameSite and Secure = yes
# max URL length = 1024
# max URL name length = 50
# use mmap = no
# netdata management api key file = /opt/netdata/var/lib/netdata/netdata.api.key
# allow from = *
# allow by dns = heuristic
[global statistics]
# update every = 1
[plugins]
# timex = yes
# idlejitter = yes
# netdata monitoring = yes
# profile = no
# tc = yes
# diskspace = yes
# proc = yes
# cgroups = yes
# statsd = yes
# enable running new plugins = yes
# check for new plugins every = 60
# slabinfo = no
# apps = yes
# charts.d = yes
# debugfs = yes
# ebpf = yes
# go.d = yes
# ioping = yes
# nfacct = yes
# perf = yes
# python.d = yes
[statsd]
# update every (flushInterval) = 1
# udp messages to process at once = 10
# create private charts for metrics matching = *
# max private charts hard limit = 1000
# set charts as obsolete after secs = 0
# decimal detail = 1000
# disconnect idle tcp clients after seconds = 600
# private charts hidden = no
# histograms and timers percentile (percentThreshold) = 95.00000
# dictionaries max unique dimensions = 200
# add dimension for number of events received = no
# gaps on gauges (deleteGauges) = no
# gaps on counters (deleteCounters) = no
# gaps on meters (deleteMeters) = no
# gaps on sets (deleteSets) = no
# gaps on histograms (deleteHistograms) = no
# gaps on timers (deleteTimers) = no
# gaps on dictionaries (deleteDictionaries) = no
# statsd server max TCP sockets = 1024
# listen backlog = 4096
# default port = 8125
# bind to = udp:localhost tcp:localhost
[plugin:timex]
# update every = 10
# clock synchronization state = yes
# time offset = yes
[plugin:idlejitter]
# loop time in ms = 20
[plugin:apps]
# update every = 1
# command options =
[plugin:charts.d]
# update every = 1
# command options =
[plugin:debugfs]
# update every = 1
# command options =
[plugin:ebpf]
# update every = 1
# command options =
[plugin:go.d]
# update every = 1
# command options =
[plugin:ioping]
# update every = 1
# command options =
[plugin:nfacct]
# update every = 1
# command options =
[plugin:perf]
# update every = 1
# command options =
[plugin:python.d]
# update every = 1
# command options =
[plugin:cgroups]
# update every = 1
# check for new cgroups every = 10
# use unified cgroups = auto
# containers priority = 40000
# enable cpuacct stat (total CPU) = auto
# enable cpuacct usage (per core CPU) = no
# enable cpuacct cpu throttling = yes
# enable cpuacct cpu shares = no
# enable memory = auto
# enable detailed memory = auto
# enable memory limits fail count = auto
# enable swap memory = auto
# enable blkio bandwidth = auto
# enable blkio operations = auto
# enable blkio throttle bandwidth = auto
# enable blkio throttle operations = auto
# enable blkio queued operations = auto
# enable blkio merged operations = auto
# enable cpu pressure = auto
# enable io some pressure = auto
# enable io full pressure = auto
# enable memory some pressure = auto
# enable memory full pressure = auto
# recheck zero blkio every iterations = 10
# recheck zero memory failcnt every iterations = 10
# recheck zero detailed memory every iterations = 10
# enable systemd services = yes
# enable systemd services detailed memory = no
# report used memory = yes
# path to /sys/fs/cgroup/cpuacct = /sys/fs/cgroup/cpu,cpuacct
# path to /sys/fs/cgroup/cpuset = /sys/fs/cgroup/cpuset
# path to /sys/fs/cgroup/blkio = /sys/fs/cgroup/blkio
# path to /sys/fs/cgroup/memory = /sys/fs/cgroup/memory
# path to /sys/fs/cgroup/devices = /sys/fs/cgroup/devices
# path to /sys/fs/cgroup/pids = /sys/fs/cgroup/pids
# max cgroups to allow = 1000
# max cgroups depth to monitor = 0
# enable by default cgroups matching = !*/init.scope !/system.slice/run-*.scope *.scope /machine.slice/*.service */kubepods/pod*/* */kubepods/*/pod*/* */*-kubepods-pod*/* */
*-kubepods-*-pod*/* !*kubepods* !*kubelet* !*/vcpu* !*/emulator !*.mount !*.partition !*.service !*.service/udev !*.socket !*.slice !*.swap !*.user !/ !/docker !*/libvirt !/l
xc !/lxc/*/* !/lxc.monitor* !/lxc.pivot !/lxc.payload !/machine !/qemu !/system !/systemd !/user *
# enable by default cgroups names matching = *
# search for cgroups in subpaths matching = !*/init.scope !*-qemu !*.libvirt-qemu !/init.scope !/system !/systemd !/user !/user.slice !/lxc/*/* !/lxc.monitor !/lxc.payloa
d/*/* !/lxc.payload.* *
# script to get cgroup names = /opt/netdata/usr/libexec/netdata/plugins.d/cgroup-name.sh
# script to get cgroup network interfaces = /opt/netdata/usr/libexec/netdata/plugins.d/cgroup-network
# run script to rename cgroups matching = !/ !*.mount !*.socket !*.partition /machine.slice/*.service !*.service !*.slice !*.swap !*.user !init.scope !*.scope/vcpu* !*.s
cope/emulator *.scope *docker* *lxc* *qemu* */kubepods/pod*/* */kubepods/*/pod*/* */*-kubepods-pod*/* */*-kubepods-*-pod*/* !*kubepods* !*kubelet* *.libvirt-qemu *
# cgroups to match as systemd services = !/system.slice/*/*.service /system.slice/*.service
# meminfo filename to monitor = /proc/meminfo
[plugin:proc:diskspace]
# remove charts of unmounted disks = yes
# update every = 1
# check for new mount points every = 15
# exclude space metrics on paths = /proc/* /sys/* /var/run/user/* /run/user/* /snap/* /var/lib/docker/*
# exclude space metrics on filesystems = *gvfs *gluster* *s3fs *ipfs *davfs2 *httpfs *sshfs *gdfs *moosefs fusectl autofs
# exclude inode metrics on filesystems = msdosfs msdos vfat overlayfs aufs* *unionfs
# space usage for all disks = auto
# inodes usage for all disks = auto
[plugin:tc]
# script to run to get tc values = /opt/netdata/usr/libexec/netdata/plugins.d/tc-qos-helper.sh
[plugin:proc]
# /proc/net/dev = yes
# /proc/pagetypeinfo = no
# /proc/stat = yes
# /proc/uptime = yes
# /proc/loadavg = yes
# /proc/sys/fs/file-nr = yes
# /proc/sys/kernel/random/entropy_avail = yes
# /proc/pressure = yes
# /proc/interrupts = yes
# /proc/softirqs = yes
# /proc/vmstat = yes
# /proc/meminfo = yes
# /sys/kernel/mm/ksm = yes
# /sys/block/zram = yes
# /sys/devices/system/edac/mc = yes
# /sys/devices/pci/aer = yes
# /sys/devices/system/node = yes
# /proc/net/wireless = yes
# /proc/net/sockstat = yes
# /proc/net/sockstat6 = yes
# /proc/net/netstat = yes
# /proc/net/sctp/snmp = yes
# /proc/net/softnet_stat = yes
# /proc/net/ip_vs/stats = yes
# /sys/class/infiniband = yes
# /proc/net/stat/conntrack = yes
# /proc/net/stat/synproxy = yes
# /proc/diskstats = yes
# /proc/mdstat = yes
# /proc/net/rpc/nfsd = yes
# /proc/net/rpc/nfs = yes
# /proc/spl/kstat/zfs/arcstats = yes
# /proc/spl/kstat/zfs/pool/state = yes
# /sys/fs/btrfs = yes
# ipc = yes
# /sys/class/power_supply = yes
# /sys/class/drm = yes
[plugin:proc:/proc/stat]
# cpu utilization = yes
# per cpu core utilization = yes
# cpu interrupts = yes
# context switches = yes
# processes started = yes
# processes running = yes
# keep per core files open = yes
# keep cpuidle files open = yes
# core_throttle_count = auto
# package_throttle_count = no
# cpu frequency = yes
# cpu idle states = yes
# core_throttle_count filename to monitor = /sys/devices/system/cpu/%s/thermal_throttle/core_throttle_count
# package_throttle_count filename to monitor = /sys/devices/system/cpu/%s/thermal_throttle/package_throttle_count
# scaling_cur_freq filename to monitor = /sys/devices/system/cpu/%s/cpufreq/scaling_cur_freq
# time_in_state filename to monitor = /sys/devices/system/cpu/%s/cpufreq/stats/time_in_state
# schedstat filename to monitor = /proc/schedstat
# cpuidle name filename to monitor = /sys/devices/system/cpu/cpu%zu/cpuidle/state%zu/name
# cpuidle time filename to monitor = /sys/devices/system/cpu/cpu%zu/cpuidle/state%zu/time
# filename to monitor = /proc/stat
[plugin:proc:/proc/uptime]
# filename to monitor = /proc/uptime
[plugin:proc:/proc/loadavg]
# filename to monitor = /proc/loadavg
# enable load average = yes
# enable total processes = yes
[plugin:proc:/proc/net/dev]
# filename to monitor = /proc/net/dev
# path to get virtual interfaces = /sys/devices/virtual/net/%s
# path to get net device speed = /sys/class/net/%s/speed
# path to get net device duplex = /sys/class/net/%s/duplex
# path to get net device operstate = /sys/class/net/%s/operstate
# path to get net device carrier = /sys/class/net/%s/carrier
# path to get net device mtu = /sys/class/net/%s/mtu
# enable new interfaces detected at runtime = auto
# bandwidth for all interfaces = auto
# packets for all interfaces = auto
# errors for all interfaces = auto
# drops for all interfaces = auto
# fifo for all interfaces = auto
# compressed packets for all interfaces = auto
# frames, collisions, carrier counters for all interfaces = auto
# speed for all interfaces = auto
# duplex for all interfaces = auto
# operstate for all interfaces = auto
# carrier for all interfaces = auto
# mtu for all interfaces = auto
# disable by default interfaces matching = lo fireqos* *-ifb fwpr* fwbr* fwln*
[plugin:proc:/proc/net/dev:lo]
# enabled = no
# virtual = yes
[plugin:proc:/proc/net/dev:ens33]
# enabled = yes
# virtual = no
# bandwidth = auto
# packets = auto
# errors = auto
# drops = auto
# fifo = auto
# compressed = auto
# events = auto
# speed = auto
# duplex = auto
# operstate = auto
# carrier = auto
# mtu = auto
[plugin:proc:/proc/sys/fs/file-nr]
# filename to monitor = /proc/sys/fs/file-nr
[plugin:proc:/proc/sys/kernel/random/entropy_avail]
# filename to monitor = /proc/sys/kernel/random/entropy_avail
[plugin:proc:/proc/pressure]
# base path of pressure metrics = /proc/pressure
# enable cpu some pressure = yes
# enable cpu full pressure = no
# enable memory some pressure = yes
# enable memory full pressure = yes
# enable io some pressure = yes
# enable io full pressure = yes
# enable irq some pressure = no
# enable irq full pressure = yes
[plugin:proc:/proc/interrupts]
# interrupts per core = auto
# filename to monitor = /proc/interrupts
[plugin:proc:/proc/softirqs]
# interrupts per core = auto
# filename to monitor = /proc/softirqs
[plugin:proc:/proc/vmstat]
# filename to monitor = /proc/vmstat
# swap i/o = auto
# disk i/o = yes
# memory page faults = yes
# out of memory kills = yes
# system-wide numa metric summary = auto
# transparent huge pages = auto
# zswap i/o = auto
# memory ballooning = auto
# kernel same memory = auto
[plugin:proc:/sys/devices/system/node]
# directory to monitor = /sys/devices/system/node
# enable per-node numa metrics = auto
[plugin:proc:/proc/meminfo]
# system ram = yes
# system swap = auto
# hardware corrupted ECC = auto
# committed memory = yes
# writeback memory = yes
# kernel memory = yes
# slab memory = yes
# hugepages = auto
# transparent hugepages = auto
# memory reclaiming = yes
# high low memory = yes
# cma memory = yes
# direct maps = yes
# filename to monitor = /proc/meminfo
[plugin:proc:/sys/kernel/mm/ksm]
# /sys/kernel/mm/ksm/pages_shared = /sys/kernel/mm/ksm/pages_shared
# /sys/kernel/mm/ksm/pages_sharing = /sys/kernel/mm/ksm/pages_sharing
# /sys/kernel/mm/ksm/pages_unshared = /sys/kernel/mm/ksm/pages_unshared
# /sys/kernel/mm/ksm/pages_volatile = /sys/kernel/mm/ksm/pages_volatile
[plugin:proc:/sys/devices/system/edac/mc]
# directory to monitor = /sys/devices/system/edac/mc
[plugin:proc:/sys/class/pci/aer]
# enable root ports = no
# enable pci slots = no
[plugin:proc:/proc/net/wireless]
# filename to monitor = /proc/net/wireless
# status for all interfaces = auto
# quality for all interfaces = auto
# discarded packets for all interfaces = auto
# missed beacon for all interface = auto
[plugin:proc:/proc/net/sockstat]
# ipv4 sockets = auto
# ipv4 TCP sockets = auto
# ipv4 TCP memory = auto
# ipv4 UDP sockets = auto
# ipv4 UDP memory = auto
# ipv4 UDPLITE sockets = auto
# ipv4 RAW sockets = auto
# ipv4 FRAG sockets = auto
# ipv4 FRAG memory = auto
# update constants every = 60
# filename to monitor = /proc/net/sockstat
[plugin:proc:/proc/net/sockstat6]
# ipv6 TCP sockets = auto
# ipv6 UDP sockets = auto
# ipv6 UDPLITE sockets = auto
# ipv6 RAW sockets = auto
# ipv6 FRAG sockets = auto
# filename to monitor = /proc/net/sockstat6
[plugin:proc:/proc/net/netstat]
# bandwidth = auto
# input errors = auto
# multicast bandwidth = auto
# broadcast bandwidth = auto
# multicast packets = auto
# broadcast packets = auto
# ECN packets = auto
# TCP reorders = auto
# TCP SYN cookies = auto
# TCP out-of-order queue = auto
# TCP connection aborts = auto
# TCP memory pressures = auto
# TCP SYN queue = auto
# TCP accept queue = auto
# filename to monitor = /proc/net/netstat
[plugin:proc:/proc/net/snmp]
# ipv4 packets = auto
# ipv4 fragments sent = auto
# ipv4 fragments assembly = auto
# ipv4 errors = auto
# ipv4 TCP connections = auto
# ipv4 TCP packets = auto
# ipv4 TCP errors = auto
# ipv4 TCP opens = auto
# ipv4 TCP handshake issues = auto
# ipv4 UDP packets = auto
# ipv4 UDP errors = auto
# ipv4 ICMP packets = auto
# ipv4 ICMP messages = auto
# ipv4 UDPLite packets = auto
# filename to monitor = /proc/net/snmp
[plugin:proc:/proc/net/snmp6]
# ipv6 packets = auto
# ipv6 fragments sent = auto
# ipv6 fragments assembly = auto
# ipv6 errors = auto
# ipv6 UDP packets = auto
# ipv6 UDP errors = auto
# ipv6 UDPlite packets = auto
# ipv6 UDPlite errors = auto
# bandwidth = auto
# multicast bandwidth = auto
# broadcast bandwidth = auto
# multicast packets = auto
# icmp = auto
# icmp redirects = auto
# icmp errors = auto
# icmp echos = auto
# icmp group membership = auto
# icmp router = auto
# icmp neighbor = auto
# icmp mldv2 = auto
# icmp types = auto
# ect = auto
# filename to monitor = /proc/net/snmp6
[plugin:proc:/proc/net/sctp/snmp]
# established associations = auto
# association transitions = auto
# fragmentation = auto
# packets = auto
# packet errors = auto
# chunk types = auto
# filename to monitor = /proc/net/sctp/snmp
[plugin:proc:/proc/net/softnet_stat]
# softnet_stat per core = yes
# filename to monitor = /proc/net/softnet_stat
[plugin:proc:/proc/net/ip_vs_stats]
# IPVS bandwidth = yes
# IPVS connections = yes
# IPVS packets = yes
# filename to monitor = /proc/net/ip_vs_stats
[plugin:proc:/sys/class/infiniband]
# dirname to monitor = /sys/class/infiniband
# bandwidth counters = yes
# packets counters = yes
# errors counters = yes
# hardware packets counters = auto
# hardware errors counters = auto
# monitor only active ports = auto
# disable by default interfaces matching =
# refresh ports state every seconds = 30
[plugin:proc:/proc/net/stat/nf_conntrack]
# filename to monitor = /proc/net/stat/nf_conntrack
# netfilter new connections = no
# netfilter connection changes = no
# netfilter connection expectations = no
# netfilter connection searches = no
# netfilter errors = no
# netfilter connections = no
[plugin:proc:/proc/sys/net/netfilter/nf_conntrack_max]
# filename to monitor = /proc/sys/net/netfilter/nf_conntrack_max
# read every seconds = 10
[plugin:proc:/proc/sys/net/netfilter/nf_conntrack_count]
# filename to monitor = /proc/sys/net/netfilter/nf_conntrack_count
[plugin:proc:/proc/net/stat/synproxy]
# SYNPROXY cookies = auto
# SYNPROXY SYN received = auto
# SYNPROXY connections reopened = auto
# filename to monitor = /proc/net/stat/synproxy
[plugin:proc:/proc/diskstats]
# enable new disks detected at runtime = yes
# performance metrics for physical disks = auto
# performance metrics for virtual disks = auto
# performance metrics for partitions = no
# bandwidth for all disks = auto
# operations for all disks = auto
# merged operations for all disks = auto
# i/o time for all disks = auto
# queued operations for all disks = auto
# utilization percentage for all disks = auto
# extended operations for all disks = auto
# backlog for all disks = auto
# bcache for all disks = auto
# bcache priority stats update every = 0
# remove charts of removed disks = yes
# path to get block device = /sys/block/%s
# path to get block device bcache = /sys/block/%s/bcache
# path to get virtual block device = /sys/devices/virtual/block/%s
# path to get block device infos = /sys/dev/block/%lu:%lu/%s
# path to device mapper = /dev/mapper
# path to /dev/disk = /dev/disk
# path to /sys/block = /sys/block
# path to /dev/disk/by-label = /dev/disk/by-label
# path to /dev/disk/by-id = /dev/disk/by-id
# path to /dev/vx/dsk = /dev/vx/dsk
# name disks by id = no
# preferred disk ids = *
# exclude disks = loop* ram*
# filename to monitor = /proc/diskstats
# performance metrics for disks with major 8 = yes
# performance metrics for disks with major 11 = yes
# performance metrics for disks with major 253 = yes
[plugin:proc:/proc/diskstats:sda]
# enable = yes
# enable performance metrics = yes
# bandwidth = auto
# operations = auto
# merged operations = auto
# i/o time = auto
# queued operations = auto
# utilization percentage = auto
# extended operations = auto
# backlog = auto
[plugin:proc:/proc/diskstats:sda1]
# enable = yes
# enable performance metrics = no
# bandwidth = no
# operations = no
# merged operations = no
# i/o time = no
# queued operations = no
# utilization percentage = no
# extended operations = no
# backlog = no
[plugin:proc:/proc/diskstats:sda2]
# enable = yes
# enable performance metrics = no
# bandwidth = no
# operations = no
# merged operations = no
# i/o time = no
# queued operations = no
# utilization percentage = no
# extended operations = no
# backlog = no
[plugin:proc:/proc/diskstats:centos/x207/x20x86_64]
# enable = yes
# enable performance metrics = yes
# bandwidth = auto
# operations = auto
# merged operations = auto
# i/o time = auto
# queued operations = auto
# utilization percentage = auto
# extended operations = auto
# backlog = auto
[plugin:proc:/proc/diskstats:centos-root]
# enable = yes
# enable performance metrics = yes
# bandwidth = auto
# operations = auto
# merged operations = auto
# i/o time = auto
# queued operations = auto
# utilization percentage = auto
# extended operations = auto
# backlog = auto
[plugin:proc:/proc/diskstats:centos-swap]
# enable = yes
# enable performance metrics = yes
# bandwidth = auto
# operations = auto
# merged operations = auto
# i/o time = auto
# queued operations = auto
# utilization percentage = auto
# extended operations = auto
# backlog = auto
[plugin:proc:/proc/mdstat]
# faulty devices = yes
# nonredundant arrays availability = yes
# mismatch count = auto
# disk stats = yes
# operation status = yes
# make charts obsolete = yes
# filename to monitor = /proc/mdstat
# mismatch_cnt filename to monitor = /sys/block/%s/md/mismatch_cnt
[plugin:proc:/proc/net/rpc/nfsd]
# filename to monitor = /proc/net/rpc/nfsd
[plugin:proc:/proc/net/rpc/nfs]
# filename to monitor = /proc/net/rpc/nfs
[plugin:proc:/proc/spl/kstat/zfs/arcstats]
# filename to monitor = /proc/spl/kstat/zfs/arcstats
[plugin:proc:/proc/spl/kstat/zfs]
# directory to monitor = /proc/spl/kstat/zfs
[plugin:proc:/sys/fs/btrfs]
# path to monitor = /sys/fs/btrfs
# check for btrfs changes every = 60
# physical disks allocation = auto
# data allocation = auto
# metadata allocation = auto
# system allocation = auto
# commit stats = auto
# error stats = auto
[plugin:proc:ipc]
# message queues = yes
# semaphore totals = yes
# shared memory totals = yes
# msg filename to monitor = /proc/sysvipc/msg
# shm filename to monitor = /proc/sysvipc/shm
# max dimensions in memory allowed = 50
[plugin:proc:/sys/class/power_supply]
# battery capacity = yes
# battery charge = no
# battery energy = no
# power supply voltage = no
# keep files open = auto
# directory to monitor = /sys/class/power_supply
[plugin:proc:/sys/class/drm]
# directory to monitor = /sys/class/drm
[plugin:proc:diskspace:/dev]
# space usage = auto
# inodes usage = auto
[plugin:proc:diskspace:/sys/kernel/security]
# space usage = no
# inodes usage = no
[plugin:proc:diskspace:/dev/shm]
# space usage = auto
# inodes usage = auto
[plugin:proc:diskspace:/run]
# space usage = auto
# inodes usage = auto
[plugin:proc:diskspace:/sys/fs/cgroup]
# space usage = no
# inodes usage = no
[plugin:proc:diskspace:/sys/fs/cgroup/systemd]
# space usage = no
# inodes usage = no
[plugin:proc:diskspace:/sys/fs/pstore]
# space usage = no
# inodes usage = no
[plugin:proc:diskspace:/sys/fs/cgroup/cpu,cpuacct]
# space usage = no
# inodes usage = no
[plugin:proc:diskspace:/sys/fs/cgroup/blkio]
# space usage = no
# inodes usage = no
[plugin:proc:diskspace:/sys/fs/cgroup/net_cls,net_prio]
# space usage = no
# inodes usage = no
[plugin:proc:diskspace:/sys/fs/cgroup/perf_event]
# space usage = no
# inodes usage = no
[plugin:proc:diskspace:/sys/fs/cgroup/cpuset]
# space usage = no
# inodes usage = no
[plugin:proc:diskspace:/sys/fs/cgroup/pids]
# space usage = no
# inodes usage = no
[plugin:proc:diskspace:/sys/fs/cgroup/memory]
# space usage = no
# inodes usage = no
[plugin:proc:diskspace:/sys/fs/cgroup/freezer]
# space usage = no
# inodes usage = no
[plugin:proc:diskspace:/sys/fs/cgroup/hugetlb]
# space usage = no
# inodes usage = no
[plugin:proc:diskspace:/sys/fs/cgroup/devices]
# space usage = no
# inodes usage = no
[plugin:proc:diskspace:/sys/kernel/config]
# space usage = no
# inodes usage = no
[plugin:proc:diskspace:/]
# space usage = auto
# inodes usage = auto
[plugin:proc:diskspace:/dev/hugepages]
# space usage = auto
# inodes usage = auto
[plugin:proc:diskspace:/boot]
# space usage = auto
# inodes usage = auto
[plugin:proc:diskspace:/run/user/0]
# space usage = no
# inodes usage = no
- edit stream.conf
vi /opt/netdata/etc/netdata/stream.conf

# netdata configuration for aggregating data from remote hosts
#
# API keys authorize a pair of sending-receiving netdata servers.
# Once their communication is authorized, they can exchange metrics for any
# number of hosts.
#
# You can generate API keys, with the linux command: uuidgen


# -----------------------------------------------------------------------------
# 1. ON CHILD NETDATA - THE ONE THAT WILL BE SENDING METRICS

[stream]
    # Enable this on child nodes, to have them send metrics.
    enabled = no

    # Where is the receiving netdata?
    # A space separated list of:
    #
    #      [PROTOCOL:]HOST[%INTERFACE][:PORT][:SSL]
    #
    # If many are given, the first available will get the metrics.
    #
    # PROTOCOL  = tcp, udp, or unix (only tcp and unix are supported by parent nodes)
    # HOST      = an IPv4, IPv6 IP, or a hostname, or a unix domain socket path.
    #             IPv6 IPs should be given with brackets [ip:address]
    # INTERFACE = the network interface to use (only for IPv6)
    # PORT      = the port number or service name (/etc/services)
    # SSL       = when this word appear at the end of the destination string
    #             the Netdata will encrypt the connection with the parent.
    #
    # This communication is not HTTP (it cannot be proxied by web proxies).
    destination =

    # Skip Certificate verification?
    # The netdata child is configurated to avoid invalid SSL/TLS certificate,
    # so certificates that are self-signed or expired will stop the streaming.
    # Case the server certificate is not valid, you can enable the use of
    # 'bad' certificates setting the next option as 'yes'.
    #ssl skip certificate verification = yes

    # Certificate Authority Path
    # OpenSSL has a default directory where the known certificates are stored.
    # In case it is necessary, it is possible to change this rule using the variable
    # "CApath", e.g. CApath = /etc/ssl/certs/
    #
    #CApath =

    # Certificate Authority file
    # When the Netdata parent has a certificate that is not recognized as valid,
    # we can add it to the list of known certificates in "CApath" and give it to
    # Netdata as an argument, e.g. CAfile = /etc/ssl/certs/cert.pem
    #
    #CAfile =

    # The API_KEY to use (as the sender)
    api key =

    # Stream Compression
    # The default is enabled
    # You can control stream compression in this agent with options: yes | no
    #enable compression = yes

    # The timeout to connect and send metrics
    timeout seconds = 60

    # If the destination line above does not specify a port, use this
    default port = 19999

    # filter the charts to be streamed
    # netdata SIMPLE PATTERN:
    # - space separated list of patterns (use \ to include spaces in patterns)
    # - use * as wildcard, any number of times within each pattern
    # - prefix a pattern with ! for a negative match (ie not stream the charts it matches)
    # - the order of patterns is important (left to right)
    # To send all except a few, use: !this !that *   (ie append a wildcard pattern)
    send charts matching = *

    # The buffer to use for sending metrics.
    # 10MB is good for 60 seconds of data, so increase this if you expect latencies.
    # The buffer is flushed on reconnects (this will not prevent gaps at the charts).
    buffer size bytes = 10485760

    # If the connection fails, or it disconnects,
    # retry after that many seconds.
    reconnect delay seconds = 5

    # Sync the clock of the charts for that many iterations, when starting.
    # It is ignored when replication is enabled
    initial clock resync iterations = 60

# -----------------------------------------------------------------------------
# 2. ON PARENT NETDATA - THE ONE THAT WILL BE RECEIVING METRICS

#    You can have one API key per child,
#         or the same API key for all child nodes.
#
#    netdata searches for options in this order:
#
#    a) parent netdata settings (netdata.conf)
#    b) [stream] section        (above)
#    c) [API_KEY] section       (below, settings for the API key)
#    d) [MACHINE_GUID] section  (below, settings for each machine)
#
#    You can combine the above (the more specific setting will be used).

# API key authentication
# If the key is not listed here, it will not be able to push metrics.

# [API_KEY] is [YOUR-API-KEY], i.e [11111111-2222-3333-4444-555555555555]
#[API_KEY]
[9447dae1-0830-4edd-9e70-1cd125844b65]
    #enabled = yes
    #default memory mode = dbengine
    #health enabled by default = auto
    #allow from = *

    # Default settings for this API key

    # This GUID is to be used as an API key from remote agents connecting
    # to this machine. Failure to match such a key, denies access.
    # YOU MUST SET THIS FIELD ON ALL API KEYS.
    type = api

    # You can disable the API key, by setting this to: no
    # The default (for unknown API keys) is: no
    enabled = yes

    # A list of simple patterns matching the IPs of the servers that
    # will be pushing metrics using this API key.
    # The metrics are received via the API port, so the same IPs
    # should also be matched at netdata.conf [web].allow connections from
    allow from = *

    # The default history in entries, for all hosts using this API key.
    # You can also set it per host below.
    # For the default db mode (dbengine), this is ignored.
    default history = 3600

    # The default memory mode to be used for all hosts using this API key.
    # You can also set it per host below.
    # If you don't set it here, the memory mode of netdata.conf will be used.
    # Valid modes:
    #    save     save on exit, load on start
    #    map      like swap (continuously syncing to disks - you need SSD)
    #    ram      keep it in RAM, don't touch the disk
    #    none     no database at all (use this on headless proxies)
    #    dbengine like a traditional database
    default memory mode = dbengine

    # Shall we enable health monitoring for the hosts using this API key?
    # 3 possible values:
    #    yes     enable alarms
    #    no      do not enable alarms
    #    auto    enable alarms, only when the sending netdata is connected.
    #            Health monitoring will be disabled as soon as the connection is closed.
    # You can also set it per host, below.
    # The default is taken from [health].enabled of netdata.conf
    health enabled by default = auto

    # postpone alarms for a short period after the sender is connected
    default postpone alarms on connect seconds = 60

    # seconds of health log events to keep
    #default health log history = 432000

    # need to route metrics differently? set these.
    # the defaults are the ones at the [stream] section (above)
    #default proxy enabled = yes | no
    #default proxy destination = IP:PORT IP:PORT ...
    #default proxy api key = API_KEY
    #default proxy send charts matching = *

    # Stream Compression
    # By default it is enabled.
    # You can control stream compression in this parent agent stream with options: yes | no
    #enable compression = yes

    # select the order the compression algorithms will be used, when multiple are offered by the child
    #compression algorithms order = zstd lz4 brotli gzip

    # Replication
    # Enable replication for all hosts using this api key. Default: enabled
    #enable replication = yes

    # How many seconds to replicate from each child. Default: a day
    #seconds to replicate = 86400

    # The duration we want to replicate per each step.
    #replication_step = 600

# -----------------------------------------------------------------------------
# 3. PER SENDING HOST SETTINGS, ON PARENT NETDATA
#    THIS IS OPTIONAL - YOU DON'T HAVE TO CONFIGURE IT

# This section exists to give you finer control of the parent settings for each
# child host, when the same API key is used by many netdata child nodes / proxies.
#
# Each netdata has a unique GUID - generated the first time netdata starts.
# You can find it at /var/lib/netdata/registry/netdata.public.unique.id
# (at the child).
#
# The host sending data will have one. If the host is not ephemeral,
# you can give settings for each sending host here.

[MACHINE_GUID]
    # This GUID is to be used as a MACHINE GUID from remote agents connecting
    # to this machine, not an API key.
    # YOU MUST SET THIS FIELD ON ALL MACHINE GUIDs.
    type = machine

    # enable this host: yes | no
    # When disabled, the parent will not receive metrics for this host.
    # THIS IS NOT A SECURITY MECHANISM - AN ATTACKER CAN SET ANY OTHER GUID.
    # Use only the API key for security.
    enabled = no

    # A list of simple patterns matching the IPs of the servers that
    # will be pushing metrics using this MACHINE GUID.
    # The metrics are received via the API port, so the same IPs
    # should also be matched at netdata.conf [web].allow connections from
    # and at stream.conf [API_KEY].allow from
    allow from = *

    # The number of entries in the database.
    # This is ignored for db mode dbengine.
    #history = 3600

    # The memory mode of the database: save | map | ram | none | dbengine
    #memory mode = dbengine

    # Health / alarms control: yes | no | auto
    #health enabled = auto

    # postpone alarms when the sender connects
    postpone alarms on connect seconds = 60

    # seconds of health log events to keep
    #health log history = 432000

    # need to route metrics differently?
    # the defaults are the ones at the [API KEY] section
    #proxy enabled = yes | no
    #proxy destination = IP:PORT IP:PORT ...
    #proxy api key = API_KEY
    #proxy send charts matching = *

    # Stream Compression
    # By default, enabled.
    # You can control stream compression in this parent agent stream with options: yes | no
    #enable compression = yes

    # Replication
    # Enable replication for all hosts using this api key.
    #enable replication = yes

    # How many seconds to replicate from each child.
    #seconds to replicate = 86400

    # The duration we want to replicate per each step.
#replication_step = 600- Restart service
 systemctl restart netdata
systemctl status netdata- Akses dashboard netdata
htpp://IP:19999

misal

http://192.168.3.30:19999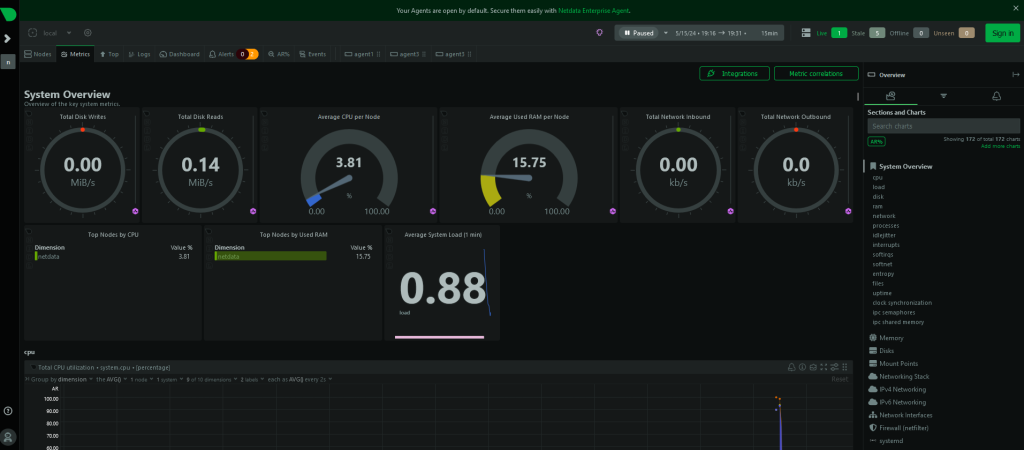
Install Netdata Child Node
- Update OS
yum update -y

atau

dnf update -y- Install dependensi
dnf install epel-release -y- Install netdata
wget -O /tmp/netdata-kickstart.sh https://get.netdata.cloud/kickstart.sh && sh /tmp/netdata-kickstart.sh --stable-channel --disable-telemetry --static-only- Run Service
systemctl start netdata

systemctl enable netdata

systemctl status netdata- Allow Firewall
firewall-cmd --permanent --add-port=19999/tcp
firewall-cmd --reload- Cek file netdata harusnya seperti di bawah
- Edit netdata.conf
# netdata configuration
#
# You can download the latest version of this file, using:
#
# wget -O /etc/netdata/netdata.conf http://localhost:19999/netdata.conf
# or
# curl -o /etc/netdata/netdata.conf http://localhost:19999/netdata.conf
#
# You can uncomment and change any of the options below.
# The value shown in the commented settings, is the default value.
#
# global netdata configuration
[global]
# run as user = netdata
# glibc malloc arena max for plugins = 1
# cpu cores = 2
# libuv worker threads = 16
# hostname = agent1
# host access prefix =
# enable metric correlations = yes
# metric correlations method = ks2
# timezone = Asia/Jakarta
# OOM score = 0
# process scheduling policy = batch
# process nice level = 19
# pthread stack size = 131072
[db]
update every = 1
mode = ram
# dbengine page cache size MB = 32
# dbengine extent cache size MB = 0
# dbengine enable journal integrity check = no
# dbengine disk space MB = 256
# dbengine multihost disk space MB = 256
# memory deduplication (ksm) = yes
# cleanup obsolete charts after secs = 3600
# gap when lost iterations above = 1
# enable replication = yes
# seconds to replicate = 86400
# seconds per replication step = 600
# cleanup orphan hosts after secs = 3600
# dbengine use direct io = yes
# dbengine pages per extent = 64
# storage tiers = 3
# dbengine parallel initialization = no
# dbengine tier 1 multihost disk space MB = 128
# dbengine tier 1 update every iterations = 60
# dbengine tier 1 backfill = new
# dbengine tier 2 multihost disk space MB = 64
# dbengine tier 2 update every iterations = 60
# dbengine tier 2 backfill = new
# delete obsolete charts files = yes
# delete orphan hosts files = yes
# enable zero metrics = no
# replication threads = 1
[directories]
# config = /opt/netdata/etc/netdata
# stock config = /opt/netdata/usr/lib/netdata/conf.d
# log = /opt/netdata/var/log/netdata
# web = /opt/netdata/usr/share/netdata/web
# cache = /opt/netdata/var/cache/netdata
# lib = /opt/netdata/var/lib/netdata
# home = /root
# lock = /opt/netdata/var/lib/netdata/lock
# plugins = "/opt/netdata/usr/libexec/netdata/plugins.d" "/opt/netdata/etc/netdata/custom-plugins.d"
# registry = /opt/netdata/var/lib/netdata/registry
# stock health config = /opt/netdata/usr/lib/netdata/conf.d/health.d
# health config = /opt/netdata/etc/netdata/health.d
[logs]
# debug flags = 0x0000000000000000
# debug = /opt/netdata/var/log/netdata/debug.log
# error = /opt/netdata/var/log/netdata/error.log
# collector = /opt/netdata/var/log/netdata/collector.log
# access = /opt/netdata/var/log/netdata/access.log
# health = /opt/netdata/var/log/netdata/health.log
# facility = daemon
# errors flood protection period = 1200
# errors to trigger flood protection = 200
# severity level = info
[environment variables]
# PATH = /opt/netdata/bin:/usr/local/sbin:/usr/local/bin:/usr/sbin:/usr/bin:/sbin:/usr/sbin:/usr/local/bin:/usr/local/sbin
# PYTHONPATH =
# TZ = :/etc/localtime
[host labels]
# name = value
[sqlite]
# auto vacuum = INCREMENTAL
# synchronous = NORMAL
# journal mode = WAL
# temp store = MEMORY
# journal size limit = 16777216
# cache size = -2000
[cloud]
# conversation log = no
# proxy = env
# query thread count = 2
[ml]
enabled = no
# maximum num samples to train = 21600
# minimum num samples to train = 900
# train every = 10800
# number of models per dimension = 18
# delete models older than = 604800
# num samples to diff = 1
# num samples to smooth = 3
# num samples to lag = 5
# random sampling ratio = 0.20000
# maximum number of k-means iterations = 1000
# dimension anomaly score threshold = 0.99000
# host anomaly rate threshold = 1.00000
# anomaly detection grouping method = average
# anomaly detection grouping duration = 300
# num training threads = 4
# flush models batch size = 128
# dimension anomaly rate suppression window = 900
# dimension anomaly rate suppression threshold = 450
# enable statistics charts = yes
# hosts to skip from training = !*
# charts to skip from training = netdata.*
# stream anomaly detection charts = yes
[health]
# silencers file = /opt/netdata/var/lib/netdata/health.silencers.json
enabled = no
# is ephemeral = no
# has unstable connection = no
# run at least every seconds = 10
# postpone alarms during hibernation for seconds = 60
# default repeat warning = never
# default repeat critical = never
# in memory max health log entries = 1000
# health log history = 432000
# enabled alarms = *
# script to execute on alarm = /opt/netdata/usr/libexec/netdata/plugins.d/alarm-notify.sh
# use summary for notifications = yes
# enable stock health configuration = yes
[web]
# ssl key = /opt/netdata/etc/netdata/ssl/key.pem
# ssl certificate = /opt/netdata/etc/netdata/ssl/cert.pem
# tls version = 1.3
# tls ciphers = none
# ses max tg_des_window = 15
# des max tg_des_window = 15
# mode = static-threaded
# listen backlog = 4096
# default port = 19999
# bind to = *
# disconnect idle clients after seconds = 60
# timeout for first request = 60
# accept a streaming request every seconds = 0
# respect do not track policy = no
# x-frame-options response header =
# allow connections from = localhost *
# allow connections by dns = heuristic
# allow dashboard from = localhost *
# allow dashboard by dns = heuristic
# allow badges from = *
# allow badges by dns = heuristic
# allow streaming from = *
# allow streaming by dns = heuristic
# allow netdata.conf from = localhost fd* 10.* 192.168.* 172.16.* 172.17.* 172.18.* 172.19.* 172.20.* 172.21.* 172.22.* 172.23.* 172.24.* 172.25.* 172.26.* 172.27.* 172.28.* 172.29.
* 172.30.* 172.31.* UNKNOWN
# allow netdata.conf by dns = no
# allow management from = localhost
# allow management by dns = heuristic
# enable gzip compression = yes
# gzip compression strategy = default
# gzip compression level = 3
# ssl skip certificate verification = no
# web server threads = 2
# web server max sockets = 1024
[httpd]
# enabled = no
[registry]
# enabled = no
# netdata unique id file = /opt/netdata/var/lib/netdata/registry/netdata.public.unique.id
# registry db file = /opt/netdata/var/lib/netdata/registry/registry.db
# registry log file = /opt/netdata/var/lib/netdata/registry/registry-log.db
# registry save db every new entries = 1000000
# registry expire idle persons days = 365
# registry domain =
# registry to announce = https://registry.my-netdata.io
# registry hostname = agent1
# verify browser cookies support = yes
# enable cookies SameSite and Secure = yes
# max URL length = 1024
# max URL name length = 50
# use mmap = no
# netdata management api key file = /opt/netdata/var/lib/netdata/netdata.api.key
# allow from = *
# allow by dns = heuristic
[global statistics]
# update every = 1
[plugins]
# timex = yes
# idlejitter = yes
# netdata monitoring = yes
# profile = no
# tc = yes
# diskspace = yes
# proc = yes
# cgroups = yes
# enable running new plugins = yes
# check for new plugins every = 60
# slabinfo = no
# apps = yes
# statsd = yes
# charts.d = yes
# debugfs = yes
# ebpf = yes
# go.d = yes
# ioping = yes
# nfacct = yes
# perf = yes
# python.d = yes
[statsd]
# update every (flushInterval) = 1
# udp messages to process at once = 10
# create private charts for metrics matching = *
# max private charts hard limit = 1000
# set charts as obsolete after secs = 0
# decimal detail = 1000
# disconnect idle tcp clients after seconds = 600
# private charts hidden = no
# histograms and timers percentile (percentThreshold) = 95.00000
# dictionaries max unique dimensions = 200
# add dimension for number of events received = no
# gaps on gauges (deleteGauges) = no
# gaps on counters (deleteCounters) = no
# gaps on meters (deleteMeters) = no
# gaps on sets (deleteSets) = no
# gaps on histograms (deleteHistograms) = no
# gaps on timers (deleteTimers) = no
# gaps on dictionaries (deleteDictionaries) = no
# statsd server max TCP sockets = 1024
# listen backlog = 4096
# default port = 8125
# bind to = udp:localhost tcp:localhost
[plugin:timex]
# update every = 10
# clock synchronization state = yes
# time offset = yes
[plugin:apps]
# update every = 1
# command options =
[plugin:idlejitter]
# loop time in ms = 20
[plugin:charts.d]
# update every = 1
# command options =
[plugin:debugfs]
# update every = 1
# command options =
[plugin:proc]
# /proc/net/dev = yes
# /proc/pagetypeinfo = no
# /proc/stat = yes
# /proc/uptime = yes
# /proc/loadavg = yes
# /proc/sys/fs/file-nr = yes
# /proc/sys/kernel/random/entropy_avail = yes
# /proc/pressure = yes
# /proc/interrupts = yes
# /proc/softirqs = yes
# /proc/vmstat = yes
# /proc/meminfo = yes
# /sys/kernel/mm/ksm = yes
# /sys/block/zram = yes
# /sys/devices/system/edac/mc = yes
# /sys/devices/pci/aer = yes
# /sys/devices/system/node = yes
# /proc/net/wireless = yes
# /proc/net/sockstat = yes
# /proc/net/sockstat6 = yes
# /proc/net/netstat = yes
# /proc/net/sctp/snmp = yes
# /proc/net/softnet_stat = yes
# /proc/net/ip_vs/stats = yes
# /sys/class/infiniband = yes
# /proc/net/stat/conntrack = yes
# /proc/net/stat/synproxy = yes
# /proc/diskstats = yes
# /proc/mdstat = yes
# /proc/net/rpc/nfsd = yes
# /proc/net/rpc/nfs = yes
# /proc/spl/kstat/zfs/arcstats = yes
# /proc/spl/kstat/zfs/pool/state = yes
# /sys/fs/btrfs = yes
# ipc = yes
# /sys/class/power_supply = yes
# /sys/class/drm = yes
[plugin:tc]
# script to run to get tc values = /opt/netdata/usr/libexec/netdata/plugins.d/tc-qos-helper.sh
[plugin:ebpf]
# update every = 1
# command options =
[plugin:go.d]
# update every = 1
# command options =
[plugin:ioping]
# update every = 1
# command options =
[plugin:nfacct]
# update every = 1
# command options =
[plugin:perf]
# update every = 1
# command options =
[plugin:python.d]
# update every = 1
# command options =
[plugin:proc:diskspace]
# remove charts of unmounted disks = yes
# update every = 1
# check for new mount points every = 15
# exclude space metrics on paths = /proc/* /sys/* /var/run/user/* /run/user/* /snap/* /var/lib/docker/*
# exclude space metrics on filesystems = *gvfs *gluster* *s3fs *ipfs *davfs2 *httpfs *sshfs *gdfs *moosefs fusectl autofs
# exclude inode metrics on filesystems = msdosfs msdos vfat overlayfs aufs* *unionfs
# space usage for all disks = auto
# inodes usage for all disks = auto
[plugin:cgroups]
# update every = 1
# check for new cgroups every = 10
# use unified cgroups = auto
# containers priority = 40000
# enable cpuacct stat (total CPU) = auto
# enable cpuacct usage (per core CPU) = no
# enable cpuacct cpu throttling = yes
# enable cpuacct cpu shares = no
# enable memory = auto
# enable detailed memory = auto
# enable memory limits fail count = auto
# enable swap memory = auto
# enable blkio bandwidth = auto
# enable blkio operations = auto
# enable blkio throttle bandwidth = auto
# enable blkio throttle operations = auto
# enable blkio queued operations = auto
# enable blkio merged operations = auto
# enable cpu pressure = auto
# enable io some pressure = auto
# enable io full pressure = auto
# enable memory some pressure = auto
# enable memory full pressure = auto
# recheck zero blkio every iterations = 10
# recheck zero memory failcnt every iterations = 10
# recheck zero detailed memory every iterations = 10
# enable systemd services = yes
# enable systemd services detailed memory = no
# report used memory = yes
# path to /sys/fs/cgroup/cpuacct = /sys/fs/cgroup/cpu,cpuacct
# path to /sys/fs/cgroup/cpuset = /sys/fs/cgroup/cpuset
# path to /sys/fs/cgroup/blkio = /sys/fs/cgroup/blkio
# path to /sys/fs/cgroup/memory = /sys/fs/cgroup/memory
# path to /sys/fs/cgroup/devices = /sys/fs/cgroup/devices
# path to /sys/fs/cgroup/pids = /sys/fs/cgroup/pids
# max cgroups to allow = 1000
# max cgroups depth to monitor = 0
# enable by default cgroups matching = !*/init.scope !/system.slice/run-*.scope *.scope /machine.slice/*.service */kubepods/pod*/* */kubepods/*/pod*/* */*-kubepods-pod*/* */
*-kubepods-*-pod*/* !*kubepods* !*kubelet* !*/vcpu* !*/emulator !*.mount !*.partition !*.service !*.service/udev !*.socket !*.slice !*.swap !*.user !/ !/docker !*/libvirt !/l
xc !/lxc/*/* !/lxc.monitor* !/lxc.pivot !/lxc.payload !/machine !/qemu !/system !/systemd !/user *
# enable by default cgroups names matching = *
# search for cgroups in subpaths matching = !*/init.scope !*-qemu !*.libvirt-qemu !/init.scope !/system !/systemd !/user !/user.slice !/lxc/*/* !/lxc.monitor !/lxc.payloa
d/*/* !/lxc.payload.* *
# script to get cgroup names = /opt/netdata/usr/libexec/netdata/plugins.d/cgroup-name.sh
# script to get cgroup network interfaces = /opt/netdata/usr/libexec/netdata/plugins.d/cgroup-network
# run script to rename cgroups matching = !/ !*.mount !*.socket !*.partition /machine.slice/*.service !*.service !*.slice !*.swap !*.user !init.scope !*.scope/vcpu* !*.s
cope/emulator *.scope *docker* *lxc* *qemu* */kubepods/pod*/* */kubepods/*/pod*/* */*-kubepods-pod*/* */*-kubepods-*-pod*/* !*kubepods* !*kubelet* *.libvirt-qemu *
# cgroups to match as systemd services = !/system.slice/*/*.service /system.slice/*.service
# meminfo filename to monitor = /proc/meminfo
[plugin:proc:/proc/stat]
# cpu utilization = yes
# per cpu core utilization = yes
# cpu interrupts = yes
# context switches = yes
# processes started = yes
# processes running = yes
# keep per core files open = yes
# keep cpuidle files open = yes
# core_throttle_count = auto
# package_throttle_count = no
# cpu frequency = yes
# cpu idle states = yes
# core_throttle_count filename to monitor = /sys/devices/system/cpu/%s/thermal_throttle/core_throttle_count
# package_throttle_count filename to monitor = /sys/devices/system/cpu/%s/thermal_throttle/package_throttle_count
# scaling_cur_freq filename to monitor = /sys/devices/system/cpu/%s/cpufreq/scaling_cur_freq
# time_in_state filename to monitor = /sys/devices/system/cpu/%s/cpufreq/stats/time_in_state
# schedstat filename to monitor = /proc/schedstat
# cpuidle name filename to monitor = /sys/devices/system/cpu/cpu%zu/cpuidle/state%zu/name
# cpuidle time filename to monitor = /sys/devices/system/cpu/cpu%zu/cpuidle/state%zu/time
# filename to monitor = /proc/stat
[plugin:proc:/proc/uptime]
# filename to monitor = /proc/uptime
[plugin:proc:/proc/loadavg]
# filename to monitor = /proc/loadavg
# enable load average = yes
# enable total processes = yes
[plugin:proc:/proc/sys/fs/file-nr]
# filename to monitor = /proc/sys/fs/file-nr
[plugin:proc:/proc/sys/kernel/random/entropy_avail]
# filename to monitor = /proc/sys/kernel/random/entropy_avail
[plugin:proc:/proc/pressure]
# base path of pressure metrics = /proc/pressure
# enable cpu some pressure = yes
# enable cpu full pressure = no
# enable memory some pressure = yes
# enable memory full pressure = yes
# enable io some pressure = yes
# enable io full pressure = yes
# enable irq some pressure = no
# enable irq full pressure = yes
[plugin:proc:/proc/interrupts]
# interrupts per core = auto
# filename to monitor = /proc/interrupts
[plugin:proc:/proc/softirqs]
# interrupts per core = auto
# filename to monitor = /proc/softirqs
[plugin:proc:/proc/vmstat]
# filename to monitor = /proc/vmstat
# swap i/o = auto
# disk i/o = yes
# memory page faults = yes
# out of memory kills = yes
# system-wide numa metric summary = auto
# transparent huge pages = auto
# zswap i/o = auto
# memory ballooning = auto
# kernel same memory = auto
[plugin:proc:/sys/devices/system/node]
# directory to monitor = /sys/devices/system/node
# enable per-node numa metrics = auto
[plugin:proc:/proc/meminfo]
# system ram = yes
# system swap = auto
# hardware corrupted ECC = auto
# committed memory = yes
# writeback memory = yes
# kernel memory = yes
# slab memory = yes
# hugepages = auto
# transparent hugepages = auto
# memory reclaiming = yes
# high low memory = yes
# cma memory = yes
# direct maps = yes
# filename to monitor = /proc/meminfo
[plugin:proc:/sys/kernel/mm/ksm]
# /sys/kernel/mm/ksm/pages_shared = /sys/kernel/mm/ksm/pages_shared
# /sys/kernel/mm/ksm/pages_sharing = /sys/kernel/mm/ksm/pages_sharing
# /sys/kernel/mm/ksm/pages_unshared = /sys/kernel/mm/ksm/pages_unshared
# /sys/kernel/mm/ksm/pages_volatile = /sys/kernel/mm/ksm/pages_volatile
[plugin:proc:/sys/devices/system/edac/mc]
# directory to monitor = /sys/devices/system/edac/mc
[plugin:proc:/sys/class/pci/aer]
# enable root ports = no
# enable pci slots = no
[plugin:proc:/proc/net/wireless]
# filename to monitor = /proc/net/wireless
# status for all interfaces = auto
# quality for all interfaces = auto
# discarded packets for all interfaces = auto
# missed beacon for all interface = auto
[plugin:proc:/proc/net/sockstat]
# ipv4 sockets = auto
# ipv4 TCP sockets = auto
# ipv4 TCP memory = auto
# ipv4 UDP sockets = auto
# ipv4 UDP memory = auto
# ipv4 UDPLITE sockets = auto
# ipv4 RAW sockets = auto
# ipv4 FRAG sockets = auto
# ipv4 FRAG memory = auto
# update constants every = 60
# filename to monitor = /proc/net/sockstat
[plugin:proc:/proc/net/sockstat6]
# ipv6 TCP sockets = auto
# ipv6 UDP sockets = auto
# ipv6 UDPLITE sockets = auto
# ipv6 RAW sockets = auto
# ipv6 FRAG sockets = auto
# filename to monitor = /proc/net/sockstat6
[plugin:proc:/proc/net/netstat]
# bandwidth = auto
# input errors = auto
# multicast bandwidth = auto
# broadcast bandwidth = auto
# multicast packets = auto
# broadcast packets = auto
# ECN packets = auto
# TCP reorders = auto
# TCP SYN cookies = auto
# TCP out-of-order queue = auto
# TCP connection aborts = auto
# TCP memory pressures = auto
# TCP SYN queue = auto
# TCP accept queue = auto
# filename to monitor = /proc/net/netstat
[plugin:proc:/proc/net/snmp]
# ipv4 packets = auto
# ipv4 fragments sent = auto
# ipv4 fragments assembly = auto
# ipv4 errors = auto
# ipv4 TCP connections = auto
# ipv4 TCP packets = auto
# ipv4 TCP errors = auto
# ipv4 TCP opens = auto
# ipv4 TCP handshake issues = auto
# ipv4 UDP packets = auto
# ipv4 UDP errors = auto
# ipv4 ICMP packets = auto
# ipv4 ICMP messages = auto
# ipv4 UDPLite packets = auto
# filename to monitor = /proc/net/snmp
[plugin:proc:/proc/net/snmp6]
# ipv6 packets = auto
# ipv6 fragments sent = auto
# ipv6 fragments assembly = auto
# ipv6 errors = auto
# ipv6 UDP packets = auto
# ipv6 UDP errors = auto
# ipv6 UDPlite packets = auto
# ipv6 UDPlite errors = auto
# bandwidth = auto
# multicast bandwidth = auto
# broadcast bandwidth = auto
# multicast packets = auto
# icmp = auto
# icmp redirects = auto
# icmp errors = auto
# icmp echos = auto
# icmp group membership = auto
# icmp router = auto
# icmp neighbor = auto
# icmp mldv2 = auto
# icmp types = auto
# ect = auto
# filename to monitor = /proc/net/snmp6
[plugin:proc:/proc/net/sctp/snmp]
# established associations = auto
# association transitions = auto
# fragmentation = auto
# packets = auto
# packet errors = auto
# chunk types = auto
# filename to monitor = /proc/net/sctp/snmp
[plugin:proc:/proc/net/softnet_stat]
# softnet_stat per core = yes
# filename to monitor = /proc/net/softnet_stat
[plugin:proc:/proc/net/ip_vs_stats]
# IPVS bandwidth = yes
# IPVS connections = yes
# IPVS packets = yes
# filename to monitor = /proc/net/ip_vs_stats
[plugin:proc:/sys/class/infiniband]
# dirname to monitor = /sys/class/infiniband
# bandwidth counters = yes
# packets counters = yes
# errors counters = yes
# hardware packets counters = auto
# hardware errors counters = auto
# monitor only active ports = auto
# disable by default interfaces matching =
# refresh ports state every seconds = 30
[plugin:proc:/proc/net/stat/nf_conntrack]
# filename to monitor = /proc/net/stat/nf_conntrack
# netfilter new connections = no
# netfilter connection changes = no
# netfilter connection expectations = no
# netfilter connection searches = no
# netfilter errors = no
# netfilter connections = no
[plugin:proc:/proc/sys/net/netfilter/nf_conntrack_max]
# filename to monitor = /proc/sys/net/netfilter/nf_conntrack_max
# read every seconds = 10
[plugin:proc:/proc/sys/net/netfilter/nf_conntrack_count]
# filename to monitor = /proc/sys/net/netfilter/nf_conntrack_count
[plugin:proc:/proc/net/stat/synproxy]
# SYNPROXY cookies = auto
# SYNPROXY SYN received = auto
# SYNPROXY connections reopened = auto
# filename to monitor = /proc/net/stat/synproxy
[plugin:proc:/proc/diskstats]
# enable new disks detected at runtime = yes
# performance metrics for physical disks = auto
# performance metrics for virtual disks = auto
# performance metrics for partitions = no
# bandwidth for all disks = auto
# operations for all disks = auto
# merged operations for all disks = auto
# i/o time for all disks = auto
# queued operations for all disks = auto
# utilization percentage for all disks = auto
# extended operations for all disks = auto
# backlog for all disks = auto
# bcache for all disks = auto
# bcache priority stats update every = 0
# remove charts of removed disks = yes
# path to get block device = /sys/block/%s
# path to get block device bcache = /sys/block/%s/bcache
# path to get virtual block device = /sys/devices/virtual/block/%s
# path to get block device infos = /sys/dev/block/%lu:%lu/%s
# path to device mapper = /dev/mapper
# path to /dev/disk = /dev/disk
# path to /sys/block = /sys/block
# path to /dev/disk/by-label = /dev/disk/by-label
# path to /dev/disk/by-id = /dev/disk/by-id
# path to /dev/vx/dsk = /dev/vx/dsk
# name disks by id = no
# preferred disk ids = *
# exclude disks = loop* ram*
# filename to monitor = /proc/diskstats
# performance metrics for disks with major 11 = yes
# performance metrics for disks with major 8 = yes
# performance metrics for disks with major 253 = yes
[plugin:proc:/proc/diskstats:centos/x207/x20x86_64]
# enable = yes
# enable performance metrics = yes
# bandwidth = auto
# operations = auto
# merged operations = auto
# i/o time = auto
# queued operations = auto
# utilization percentage = auto
# extended operations = auto
# backlog = auto
[plugin:proc:/proc/diskstats:sda]
# enable = yes
# enable performance metrics = yes
# bandwidth = auto
# operations = auto
# merged operations = auto
# i/o time = auto
# queued operations = auto
# utilization percentage = auto
# extended operations = auto
# backlog = auto
[plugin:proc:/proc/diskstats:sda1]
# enable = yes
# enable performance metrics = no
# bandwidth = no
# operations = no
# merged operations = no
# i/o time = no
# queued operations = no
# utilization percentage = no
# extended operations = no
# backlog = no
[plugin:proc:/proc/diskstats:sda2]
# enable = yes
# enable performance metrics = no
# bandwidth = no
# operations = no
# merged operations = no
# i/o time = no
# queued operations = no
# utilization percentage = no
# extended operations = no
# backlog = no
[plugin:proc:/proc/diskstats:centos-root]
# enable = yes
# enable performance metrics = yes
# bandwidth = auto
# operations = auto
# merged operations = auto
# i/o time = auto
# queued operations = auto
# utilization percentage = auto
# extended operations = auto
# backlog = auto
[plugin:proc:/proc/diskstats:centos-swap]
# enable = yes
# enable performance metrics = yes
# bandwidth = auto
# operations = auto
# merged operations = auto
# i/o time = auto
# queued operations = auto
# utilization percentage = auto
# extended operations = auto
# backlog = auto
[plugin:proc:/proc/mdstat]
# faulty devices = yes
# nonredundant arrays availability = yes
# mismatch count = auto
# disk stats = yes
# operation status = yes
# make charts obsolete = yes
# filename to monitor = /proc/mdstat
# mismatch_cnt filename to monitor = /sys/block/%s/md/mismatch_cnt
[plugin:proc:/proc/net/rpc/nfsd]
# filename to monitor = /proc/net/rpc/nfsd
[plugin:proc:diskspace:/dev]
# space usage = auto
# inodes usage = auto
[plugin:proc:diskspace:/sys/kernel/security]
# space usage = no
# inodes usage = no
[plugin:proc:diskspace:/dev/shm]
# space usage = auto
# inodes usage = auto
[plugin:proc:diskspace:/run]
# space usage = auto
# inodes usage = auto
[plugin:proc:diskspace:/sys/fs/cgroup]
# space usage = no
# inodes usage = no
[plugin:proc:diskspace:/sys/fs/cgroup/systemd]
# space usage = no
# inodes usage = no
[plugin:proc:diskspace:/sys/fs/pstore]
# space usage = no
# inodes usage = no
[plugin:proc:diskspace:/sys/fs/cgroup/hugetlb]
# space usage = no
# inodes usage = no
[plugin:proc:diskspace:/sys/fs/cgroup/perf_event]
# space usage = no
# inodes usage = no
[plugin:proc:diskspace:/sys/fs/cgroup/cpuset]
# space usage = no
# inodes usage = no
[plugin:proc:diskspace:/sys/fs/cgroup/memory]
# space usage = no
# inodes usage = no
[plugin:proc:diskspace:/sys/fs/cgroup/blkio]
# space usage = no
# inodes usage = no
[plugin:proc:diskspace:/sys/fs/cgroup/net_cls,net_prio]
# space usage = no
# inodes usage = no
[plugin:proc:diskspace:/sys/fs/cgroup/cpu,cpuacct]
# space usage = no
# inodes usage = no
[plugin:proc:diskspace:/sys/fs/cgroup/pids]
# space usage = no
# inodes usage = no
[plugin:proc:diskspace:/sys/fs/cgroup/devices]
# space usage = no
# inodes usage = no
[plugin:proc:diskspace:/sys/fs/cgroup/freezer]
# space usage = no
# inodes usage = no
[plugin:proc:diskspace:/sys/kernel/config]
# space usage = no
# inodes usage = no
[plugin:proc:diskspace:/]
# space usage = auto
# inodes usage = auto
[plugin:proc:diskspace:/dev/hugepages]
# space usage = auto
# inodes usage = auto
[plugin:proc:diskspace:/boot]
# space usage = auto
# inodes usage = auto
[plugin:proc:diskspace:/run/user/0]
# space usage = no
# inodes usage = no
[plugin:proc:/proc/net/rpc/nfs]
# filename to monitor = /proc/net/rpc/nfs
[plugin:proc:/proc/spl/kstat/zfs/arcstats]
# filename to monitor = /proc/spl/kstat/zfs/arcstats
[plugin:proc:/proc/spl/kstat/zfs]
# directory to monitor = /proc/spl/kstat/zfs
[plugin:proc:/sys/fs/btrfs]
# path to monitor = /sys/fs/btrfs
# check for btrfs changes every = 60
# physical disks allocation = auto
# data allocation = auto
# metadata allocation = auto
# system allocation = auto
# commit stats = auto
# error stats = auto
[plugin:proc:ipc]
# message queues = yes
# semaphore totals = yes
# shared memory totals = yes
# msg filename to monitor = /proc/sysvipc/msg
# shm filename to monitor = /proc/sysvipc/shm
# max dimensions in memory allowed = 50
[plugin:proc:/sys/class/power_supply]
# battery capacity = yes
# battery charge = no
# battery energy = no
# power supply voltage = no
# keep files open = auto
# directory to monitor = /sys/class/power_supply
[plugin:proc:/sys/class/drm]
# directory to monitor = /sys/class/drm
[plugin:proc:/proc/net/dev]
# filename to monitor = /proc/net/dev
# path to get virtual interfaces = /sys/devices/virtual/net/%s
# path to get net device speed = /sys/class/net/%s/speed
# path to get net device duplex = /sys/class/net/%s/duplex
# path to get net device operstate = /sys/class/net/%s/operstate
# path to get net device carrier = /sys/class/net/%s/carrier
# path to get net device mtu = /sys/class/net/%s/mtu
# enable new interfaces detected at runtime = auto
# bandwidth for all interfaces = auto
# packets for all interfaces = auto
# errors for all interfaces = auto
# drops for all interfaces = auto
# fifo for all interfaces = auto
# compressed packets for all interfaces = auto
# frames, collisions, carrier counters for all interfaces = auto
# speed for all interfaces = auto
# duplex for all interfaces = auto
# operstate for all interfaces = auto
# carrier for all interfaces = auto
# mtu for all interfaces = auto
# disable by default interfaces matching = lo fireqos* *-ifb fwpr* fwbr* fwln*
[plugin:proc:/proc/net/dev:lo]
# enabled = no
# virtual = yes
[plugin:proc:/proc/net/dev:ens33]
# enabled = yes
# virtual = no
# bandwidth = auto
# packets = auto
# errors = auto
# drops = auto
# fifo = auto
# compressed = auto
# events = auto
# speed = auto
# duplex = auto
# operstate = auto
# carrier = auto
# mtu = auto- edit stream.conf
# netdata configuration for aggregating data from remote hosts
#
# API keys authorize a pair of sending-receiving netdata servers.
# Once their communication is authorized, they can exchange metrics for any
# number of hosts.
#
# You can generate API keys, with the linux command: uuidgen


# -----------------------------------------------------------------------------
# 1. ON CHILD NETDATA - THE ONE THAT WILL BE SENDING METRICS

[stream]
    # Enable this on child nodes, to have them send metrics.
    enabled = yes

    # Where is the receiving netdata?
    # A space separated list of:
    #
    #      [PROTOCOL:]HOST[%INTERFACE][:PORT][:SSL]
    #
    # If many are given, the first available will get the metrics.
    #
    # PROTOCOL  = tcp, udp, or unix (only tcp and unix are supported by parent nodes)
    # HOST      = an IPv4, IPv6 IP, or a hostname, or a unix domain socket path.
    #             IPv6 IPs should be given with brackets [ip:address]
    # INTERFACE = the network interface to use (only for IPv6)
    # PORT      = the port number or service name (/etc/services)
    # SSL       = when this word appear at the end of the destination string
    #             the Netdata will encrypt the connection with the parent.
    #
    # This communication is not HTTP (it cannot be proxied by web proxies).
    destination = 192.168.3.30:19999

    # Skip Certificate verification?
    # The netdata child is configurated to avoid invalid SSL/TLS certificate,
    # so certificates that are self-signed or expired will stop the streaming.
    # Case the server certificate is not valid, you can enable the use of
    # 'bad' certificates setting the next option as 'yes'.
    #ssl skip certificate verification = yes

    # Certificate Authority Path
    # OpenSSL has a default directory where the known certificates are stored.
    # In case it is necessary, it is possible to change this rule using the variable
    # "CApath", e.g. CApath = /etc/ssl/certs/
    #
    #CApath =

    # Certificate Authority file
    # When the Netdata parent has a certificate that is not recognized as valid,
    # we can add it to the list of known certificates in "CApath" and give it to
    # Netdata as an argument, e.g. CAfile = /etc/ssl/certs/cert.pem
    #
    #CAfile =

    # The API_KEY to use (as the sender)
    api key = 9447dae1-0830-4edd-9e70-1cd125844b65

    # Stream Compression
    # The default is enabled
    # You can control stream compression in this agent with options: yes | no
    #enable compression = yes

    # The timeout to connect and send metrics
    timeout seconds = 60

    # If the destination line above does not specify a port, use this
    default port = 19999

    # filter the charts to be streamed
    # netdata SIMPLE PATTERN:
    # - space separated list of patterns (use \ to include spaces in patterns)
    # - use * as wildcard, any number of times within each pattern
    # - prefix a pattern with ! for a negative match (ie not stream the charts it matches)
    # - the order of patterns is important (left to right)
    # To send all except a few, use: !this !that *   (ie append a wildcard pattern)
    send charts matching = *

    # The buffer to use for sending metrics.
    # 10MB is good for 60 seconds of data, so increase this if you expect latencies.
    # The buffer is flushed on reconnects (this will not prevent gaps at the charts).
    buffer size bytes = 10485760

    # If the connection fails, or it disconnects,
    # retry after that many seconds.
    reconnect delay seconds = 5

    # Sync the clock of the charts for that many iterations, when starting.
    # It is ignored when replication is enabled
    initial clock resync iterations = 60

# -----------------------------------------------------------------------------
# 2. ON PARENT NETDATA - THE ONE THAT WILL BE RECEIVING METRICS

#    You can have one API key per child,
#         or the same API key for all child nodes.
#
#    netdata searches for options in this order:
#
#    a) parent netdata settings (netdata.conf)
#    b) [stream] section        (above)
#    c) [API_KEY] section       (below, settings for the API key)
#    d) [MACHINE_GUID] section  (below, settings for each machine)
#
#    You can combine the above (the more specific setting will be used).

# API key authentication
# If the key is not listed here, it will not be able to push metrics.

# [API_KEY] is [YOUR-API-KEY], i.e [11111111-2222-3333-4444-555555555555]
[API_KEY]
    # Default settings for this API key

    # This GUID is to be used as an API key from remote agents connecting
    # to this machine. Failure to match such a key, denies access.
    # YOU MUST SET THIS FIELD ON ALL API KEYS.
    type = api

    # You can disable the API key, by setting this to: no
    # The default (for unknown API keys) is: no
    enabled = no

    # A list of simple patterns matching the IPs of the servers that
    # will be pushing metrics using this API key.
    # The metrics are received via the API port, so the same IPs
    # should also be matched at netdata.conf [web].allow connections from
    allow from = *

    # The default history in entries, for all hosts using this API key.
    # You can also set it per host below.
    # For the default db mode (dbengine), this is ignored.
    #default history = 3600

    # The default memory mode to be used for all hosts using this API key.
    # You can also set it per host below.
    # If you don't set it here, the memory mode of netdata.conf will be used.
    # Valid modes:
    #    save     save on exit, load on start
    #    map      like swap (continuously syncing to disks - you need SSD)
    #    ram      keep it in RAM, don't touch the disk
    #    none     no database at all (use this on headless proxies)
    #    dbengine like a traditional database
    #default memory mode = dbengine

    # Shall we enable health monitoring for the hosts using this API key?
    # 3 possible values:
    #    yes     enable alarms
    #    no      do not enable alarms
    #    auto    enable alarms, only when the sending netdata is connected.
    #            Health monitoring will be disabled as soon as the connection is closed.
    # You can also set it per host, below.
    # The default is taken from [health].enabled of netdata.conf
    #health enabled by default = auto

    # postpone alarms for a short period after the sender is connected
    default postpone alarms on connect seconds = 60

    # seconds of health log events to keep
    #default health log history = 432000

    # need to route metrics differently? set these.
    # the defaults are the ones at the [stream] section (above)
    #default proxy enabled = yes | no
    #default proxy destination = IP:PORT IP:PORT ...
    #default proxy api key = API_KEY
    #default proxy send charts matching = *

    # Stream Compression
    # By default it is enabled.
    # You can control stream compression in this parent agent stream with options: yes | no
    #enable compression = yes

    # select the order the compression algorithms will be used, when multiple are offered by the child
    #compression algorithms order = zstd lz4 brotli gzip

    # Replication
    # Enable replication for all hosts using this api key. Default: enabled
    #enable replication = yes

    # How many seconds to replicate from each child. Default: a day
    #seconds to replicate = 86400

    # The duration we want to replicate per each step.
    #replication_step = 600

# -----------------------------------------------------------------------------
# 3. PER SENDING HOST SETTINGS, ON PARENT NETDATA
#    THIS IS OPTIONAL - YOU DON'T HAVE TO CONFIGURE IT

# This section exists to give you finer control of the parent settings for each
# child host, when the same API key is used by many netdata child nodes / proxies.
#
# Each netdata has a unique GUID - generated the first time netdata starts.
# You can find it at /var/lib/netdata/registry/netdata.public.unique.id
# (at the child).
#
# The host sending data will have one. If the host is not ephemeral,
# you can give settings for each sending host here.

[MACHINE_GUID]
    # This GUID is to be used as a MACHINE GUID from remote agents connecting
    # to this machine, not an API key.
    # YOU MUST SET THIS FIELD ON ALL MACHINE GUIDs.
    type = machine

    # enable this host: yes | no
    # When disabled, the parent will not receive metrics for this host.
    # THIS IS NOT A SECURITY MECHANISM - AN ATTACKER CAN SET ANY OTHER GUID.
    # Use only the API key for security.
    enabled = no

    # A list of simple patterns matching the IPs of the servers that
    # will be pushing metrics using this MACHINE GUID.
    # The metrics are received via the API port, so the same IPs
    # should also be matched at netdata.conf [web].allow connections from
    # and at stream.conf [API_KEY].allow from
    allow from = *

    # The number of entries in the database.
    # This is ignored for db mode dbengine.
    #history = 3600

    # The memory mode of the database: save | map | ram | none | dbengine
    #memory mode = dbengine

    # Health / alarms control: yes | no | auto
    #health enabled = auto

    # postpone alarms when the sender connects
    postpone alarms on connect seconds = 60

    # seconds of health log events to keep
    #health log history = 432000

    # need to route metrics differently?
    # the defaults are the ones at the [API KEY] section
    #proxy enabled = yes | no
    #proxy destination = IP:PORT IP:PORT ...
    #proxy api key = API_KEY
    #proxy send charts matching = *

    # Stream Compression
    # By default, enabled.
    # You can control stream compression in this parent agent stream with options: yes | no
    #enable compression = yes

    # Replication
    # Enable replication for all hosts using this api key.
    #enable replication = yes

    # How many seconds to replicate from each child.
    #seconds to replicate = 86400

    # The duration we want to replicate per each step.
#replication_step = 600- Restart service netdata
 systemctl restart netdata
 systemctl status netdata
Cek Dashboard Parent Node
child node akan terlihat di parent node
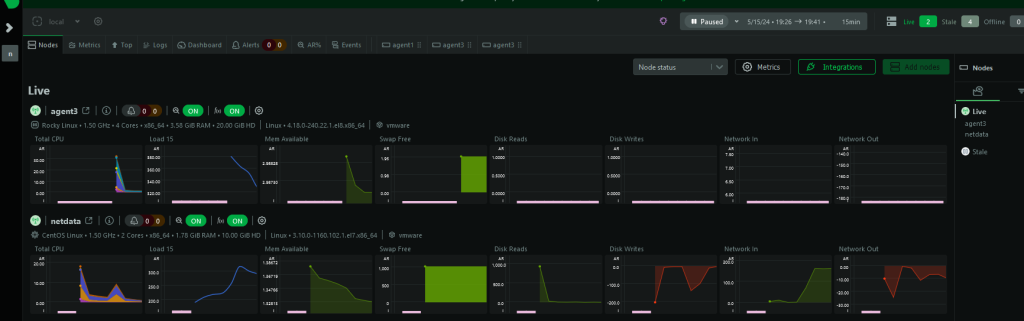
Penutup
Sahabat Blog Learning & Doing demikianlah penjelasan mengenai Install Netdata Parent dan Child Node pada Centos/Rocky linux. Semoga Bermanfaat . Sampai ketemu lagi di postingan berikut nya.