“Monitoring and Logging for Cloud Functions”
Daftar Isi
Pengantar
Di lab ini, Anda menggunakan Cloud Monitoring untuk melihat detail Cloud Functions di Google Cloud Console. Detail Cloud Function mencakup waktu dan jumlah eksekusi, serta penggunaan memori.
Praktikum
Task 1. Viewing Cloud Function logs & metrics in Cloud Monitoring
- In the Cloud Console, select Navigation menu (Navigation menu icon) > Cloud Functions, and then Create function.
- Set the following:
Function Name: helloWorld
Trigger type: HTTP
Authentication: check the box next to Allow unauthenticated invocations- Click Save.
- Expand Runtime, build, connections and security settings. Under Autoscaling, set the Maximum number of instances to 5.
- Click Next.
- Click Deploy.
- In Cloud Shell, run the following to get a tool called vegeta that will let you send some test traffic to your cloud function:
curl -LO 'https://github.com/tsenart/vegeta/releases/download/v6.3.0/vegeta-v6.3.0-linux-386.tar.gz'- Unpack the vegeta tool by running the following:
tar xvzf vegeta-v6.3.0-linux-386.tar.gz- Still in the Cloud Functions page, click the name of your function, and then click on the
Triggertab. Click the Trigger URL for your function. - Now send traffic to your cloud function. Run the following in Cloud Shell.
echo "GET https://-.cloudfunctions.net/helloWorld" | ./vegeta attack -duration=300s > results.binTask 2. Create logs-based metric
- In the Console, select Navigation menu > Logging > Logs Explorer. The Cloud Logging opens in the Console.
- To look at just the logs from your Cloud Function, in the Resource dropdown, select Cloud Function > helloWorld then click Add. In the Log name dropdown, select cloud-functions checkbox then click Add.
- Click Run query.
- Click Create metric.
- In the Create logs metric:
hange the Metric Type to Distribution.
Name your metric CloudFunctionLatency-Logs.
Enter textPayload for Field name.
Enter the following in the Regular Expression field:
execution took (\d+)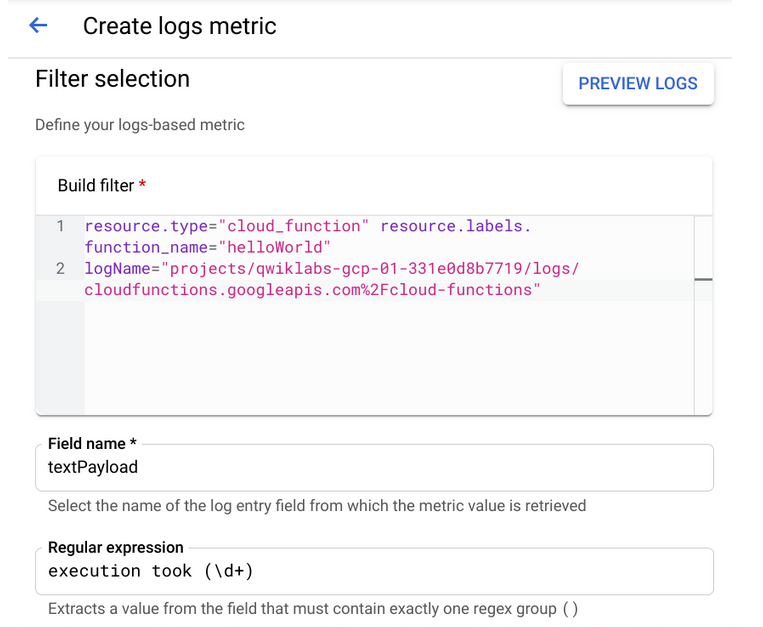
- Click Create metric.
Task 3. Metrics Explorer
Create a Monitoring Metrics Scope
- In the Cloud Console, click Navigation menu Navigation menu icon > Monitoring.
- In the left menu, click Metrics explorer.
- Start typing
executionsinto the Select a Metric dropdown, and then select Cloud Function > Function > Executions from the suggested metrics and click Apply. - Change the graph type to Stacked bar chart using the dropdown menu above the graph.
- Explore other graph options, try a different metric. For example, click your current Cloud function – Executions metric to open the dropdown, select Execution times, and change the graph type to Heatmap chart.
- Continue to explore and experiment. For example, go back to the Executions metric and change the aggregator to the 95th percentile. Select the graph type Line.
Task 4. Create charts on the Monitoring Overview window
- In the left menu, click Dashboard.
- Click on + Create dashboard.
- Click on + Add chart.
- In dropdown menu, select Stacked bar
- In the Resource & Metric section, select the default VM instance – CPU utilization metric to open the dropdown and change the metric.
- Start typing
executionsinto the Select a Metric dropdown, and then select Cloud Function > Function > Executions from the suggested metrics and click Apply. - After you create the first chart, click + ADD CHART > Heatmap to create the next one.
- In the Resource & Metric section, select the default VM INSTANCE – RTT LATENCIES metric to open the dropdown and change the metric.
- Start typing
execution timesinto the Select a Metric dropdown, and then select Cloud Function > Function > Execution times from the suggested metrics and click Apply.
Penutup
Sahabat Blog Learning & Doing demikianlah penjelasan mengenai Monitoring and Logging for Cloud Functions. Semoga Bermanfaat . Sampai ketemu lagi di postingan berikut nya.
(Visited 108 times, 1 visits today)

