“Reporting Application Metrics into Cloud Monitoring”
Daftar Isi
Pengantar
Di lab praktis ini, Anda menyiapkan aplikasi server video sederhana di Go dan melengkapinya untuk melaporkan metrik aplikasi, juga dikenal sebagai metrik kustom, ke Cloud Monitoring menggunakan library OpenCensus.
Praktikum
Task 1. Create a Compute Engine instance
- n the Cloud Console, select Navigation menu > Compute Engine > VM instances, then click Create Instance.
- Set the following fields:
Name: my-opencensus-demo
Series: E2
Machine type: e2-medium (2vCPU, 4 GB memory)
Boot disk: Click Change. Select version Debian GNU/Linux 10 (buster) for Debian OS and click Select.
Identity and API access: Select Set access for each API, then for Stackdriver Monitoring API select Full from the dropdown menu.
Firewall: Select both Allow HTTP traffic and Allow HTTPS traffic.- Leave the rest of the fields at their default values and click Create.
Task 2. Install Go and OpenCensus on your instance
You will use the SSH terminal to install the following:
- Go
- the git package
- the OpenCensus package
- the Cloud Monitoring OpenCensus exporter
- Execute the following commands in the SSH terminal:
sudo curl -O https://storage.googleapis.com/golang/go1.16.2.linux-amd64.tar.gz
sudo tar -xvf go1.16.2.linux-amd64.tar.gz
sudo rm -rf /usr/local/go
sudo mv go /usr/local
sudo apt-get update
sudo apt-get install git- You will be asked to confirm you want to continue – press Y and then ENTER.
export PATH=$PATH:/usr/local/go/bin
go get go.opencensus.io
go get contrib.go.opencensus.io/exporter/stackdriver

go mod init test3

go mod tidy
Create a Monitoring Metrics Scope
- In the Cloud Console, click Navigation menu Navigation menu icon > Monitoring.
Install agents on the VM:
- Run the following Monitoring agent install script command in the SSH terminal of your VM instance to install the Cloud Monitoring agent:
curl -sSO https://dl.google.com/cloudagents/add-google-cloud-ops-agent-repo.sh
sudo bash add-google-cloud-ops-agent-repo.sh --also-install

sudo apt-get update
Task 3. Create a basic application server in Go
- In the SSH window, use your favorite editor (
nano,vi, etc.) to create a file calledmain.gowritten in Go. For example:
nano main.go

package main
import (
        "fmt"
        "math/rand"
        "time"
)
func main() {
        // Here's our fake video processing application. Every second, it
        // checks the length of the input queue (e.g., number of videos
        // waiting to be processed) and records that information.
        for {
                time.Sleep(1 * time.Second)
                queueSize := getQueueSize()
                // Record the queue size.
                fmt.Println("Queue size: ", queueSize)
        }
}
func getQueueSize() (int64) {
        // Fake out a queue size here by returning a random number between
        // 1 and 100.
        return rand.Int63n(100) + 1
}- Run the file with:
go run main.goTask 4. Defining & recording measures using OpenCensus
- Open your
main.gofile in your text editor:
nano main.go

package main
import (
    "context" // [[Add this line]]
    "fmt"
    "math/rand"
    "time"
    "go.opencensus.io/stats" // [[Add this line]]
)
// [[Add this block]]
var videoServiceInputQueueSize = stats.Int64(
        "my.videoservice.org/measure/input_queue_size",
        "Number of videos queued up in the input queue",
        stats.UnitDimensionless)
    // [[End: add this block]]
func main() {
    ctx := context.Background() // [[Add: this line.]]
    // Here’s our fake video processing application. Every second, it
    // checks the length of the input queue (e.g., number of videos
    // waiting to be processed) and records that information.
    for {
        time.Sleep(1 * time.Second)
        queueSize := getQueueSize()
        // Record the queue size.
        // [[Add: next line.]]
        stats.Record(ctx, videoServiceInputQueueSize.M(queueSize)) // [[Add]]
        fmt.Println("Queue size: ", queueSize)
    }
}
func getQueueSize()(int64) {
    // Fake out a queue size here by returning a random number between
    // 1 and 100.
    return rand.Int63n(100) + 1
}
Task 5. Setting up metrics collection & aggregation
- Add the changes identified by
// [[Add this line]]or// [[Add this block]] … // [[End: add this block]]to yourmain.gofile, then uncomment the added lines and remove the instructions:
package main
import (
    "context"
    "fmt"
    "log" // [[Add this line]]
    "math/rand"
    "time"
    "go.opencensus.io/stats"
    "go.opencensus.io/stats/view" // [[Add this line]]
)
var videoServiceInputQueueSize = stats.Int64(
    "my.videoservice.org/measure/input_queue_size",
    "Number of videos queued up in the input queue",
    stats.UnitDimensionless)
func main() {
    ctx := context.Background()
    // [[Add this block]]
    // Setup a view so that we can export our metric.
    if err := view.Register( & view.View { // [[Add]]
        Name: "my.videoservice.org/measure/input_queue_size",
        Description: "Number of videos queued up in the input queue",
        Measure: videoServiceInputQueueSize,
        Aggregation: view.LastValue(),
    });err != nil {
        log.Fatalf("Cannot setup view: %v", err)
    }
    // Set the reporting period to be once per second.
    view.SetReportingPeriod(1 * time.Second)
    // [[End: Add this block]]
    // Here’s our fake video processing application. Every second, it
    // checks the length of the input queue (e.g., number of videos
    // waiting to be processed) and records that information.
    for {
        time.Sleep(1 * time.Second)
        queueSize := getQueueSize()
        // Record the queue size.
        stats.Record(ctx, videoServiceInputQueueSize.M(queueSize))
        fmt.Println("Queue size: ", queueSize)
    }
}
func getQueueSize()(int64) {
    // Fake out a queue size here by returning a random number between
    // 1 and 100.
    return rand.Int63n(100) + 1
}
Task 6. Reporting default metrics to Cloud Monitoring
- Add the changes identified by
// [[Add this line]]or// [[Add this block]] … // [[End: add this block]]to your file, then uncomment the added lines and remove the instructions:
package main
import (
    "context"
    "fmt"
    "log"
    "math/rand"
    "os" // [[Add]]
    "time"
    "contrib.go.opencensus.io/exporter/stackdriver" // [[Add]]
    "go.opencensus.io/stats"
    "go.opencensus.io/stats/view"
    monitoredrespb "google.golang.org/genproto/googleapis/api/monitoredres" // [[Add]]
)
var videoServiceInputQueueSize = stats.Int64(
    "my.videoservice.org/measure/input_queue_size",
    "Number of videos queued up in the input queue",
    stats.UnitDimensionless)
func main() {
    // [[Add block]]
    // Setup metrics exporting to Stackdriver.
    exporter, err := stackdriver.NewExporter(stackdriver.Options {
        ProjectID: os.Getenv("MY_PROJECT_ID"),
        Resource: & monitoredrespb.MonitoredResource {
            Type: "gce_instance",
            Labels: map[string] string {
                "instance_id": os.Getenv("MY_GCE_INSTANCE_ID"),
                "zone": os.Getenv("MY_GCE_INSTANCE_ZONE"),
            },
        },
    })
    if err != nil {
        log.Fatalf("Cannot setup Stackdriver exporter: %v", err)
    }
    view.RegisterExporter(exporter)
        // [[End: add block]]
    ctx := context.Background()
    // Setup a view so that we can export our metric.
    if err := view.Register( & view.View {
        Name: "my.videoservice.org/measure/input_queue_size",
        Description: "Number of videos queued up in the input queue",
        Measure: videoServiceInputQueueSize,
        Aggregation: view.LastValue(),
    });
    err != nil {
            log.Fatalf("Cannot setup view: %v", err)
        }
        // Set the reporting period to be once per second.
    view.SetReportingPeriod(1 * time.Second)
    // Here’s our fake video processing application. Every second, it
    // checks the length of the input queue (e.g., number of videos
    // waiting to be processed) and records that information.
    for {
        time.Sleep(1 * time.Second)
        queueSize := getQueueSize()
        // Record the queue size.
        stats.Record(ctx, videoServiceInputQueueSize.M(queueSize))
        fmt.Println("Queue size: ", queueSize)
    }
}
func getQueueSize()(int64) {
    // Fake out a queue size here by returning a random number between
    // 1 and 100.
    return rand.Int63n(100) + 1
}
Task 7. View your application metrics in Cloud Monitoring
- In the SSH window, set the necessary environment variables:
export MY_PROJECT_ID=<your-project-id>
export MY_GCE_INSTANCE_ID=my-opencensus-demo
export MY_GCE_INSTANCE_ZONE=us-west1-b

go mod tidy

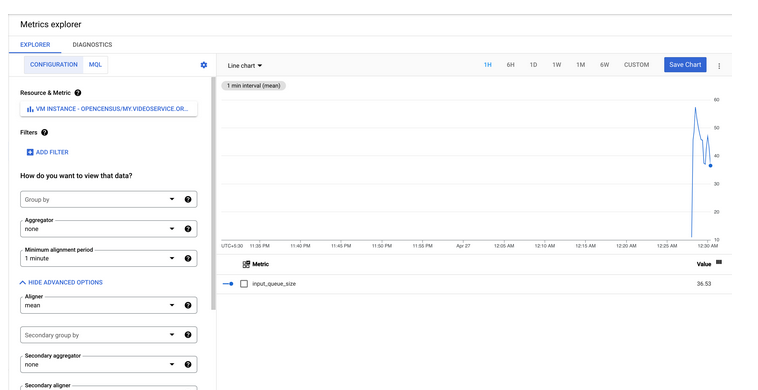
go run main.go- In the left menu, click Metrics Explorer.
- Start typing
inputinto the Select a Metric dropdown, and then select VM Instance > Custom and select OpenCensus/my.videoservice.org from the suggested metrics and click Apply.

Penutup
Sahabat Blog Learning & Doing demikianlah penjelasan mengenai Reporting Application Metrics into Cloud Monitoring. Semoga Bermanfaat . Sampai ketemu lagi di postingan berikut nya.
(Visited 132 times, 1 visits today)


