“Debugging Apps on Google Kubernetes Engine”
Pengantar
Cloud Logging, dan alat pendampingnya, Cloud Monitoring, adalah produk berfitur lengkap yang terintegrasi secara mendalam ke dalam Google Kubernetes Engine. Lab ini mengajarkan cara kerja Cloud Logging dengan cluster dan aplikasi GKE serta beberapa praktik terbaik untuk pengumpulan log melalui kasus penggunaan logging yang umum.
Praktikum
Task 1. Infrastructure setup
gcloud config set compute/zone us-central1-b
export PROJECT_ID=$(gcloud info --format='value(config.project)')
gcloud container clusters list
gcloud container clusters get-credentials central --zone us-central1-b
kubectl get nodes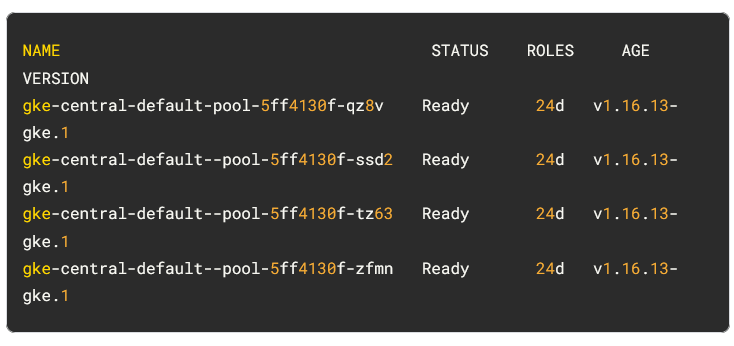
Task 2. Deploy application
git clone https://github.com/xiangshen-dk/microservices-demo.git
cd microservices-demo
kubectl apply -f release/kubernetes-manifests.yaml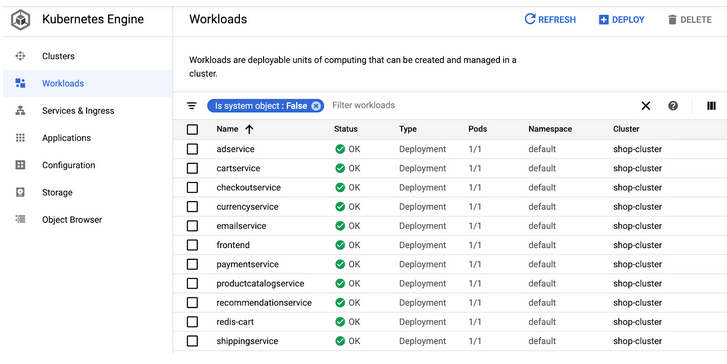
kubectl get pods- Cek external IP
export EXTERNAL_IP=$(kubectl get service frontend-external | awk 'BEGIN { cnt=0; } { cnt+=1; if (cnt > 1) print $4; }')curl -o /dev/null -s -w "%{http_code}\n" http://$EXTERNAL_IP- Klik menu Kubernetes Engine > Workloads
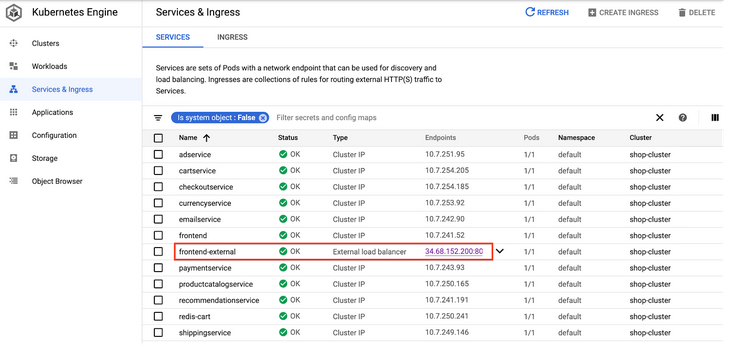
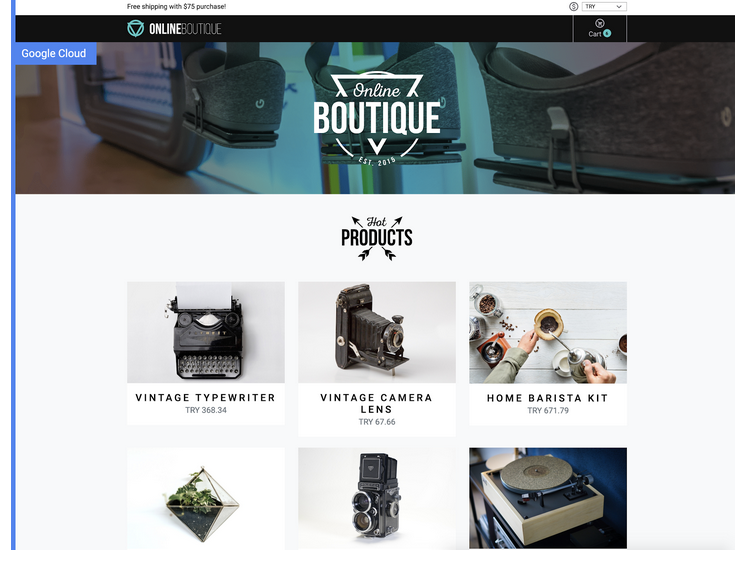
Task 3. Open the application
- Scroll down to frontend-external and click the Endpoints IP of the service.
Task 4. Create a logs-based metric
- Return to the Cloud Console, and from the Navigation menu open Logging, then click Logs Explorer.
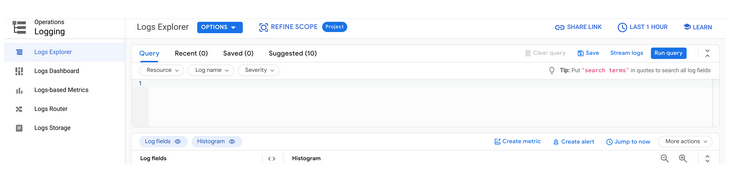
- Enable Show query and in the Query builder box, add the following query:
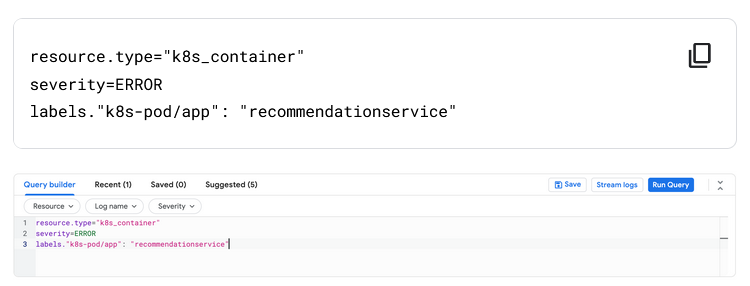
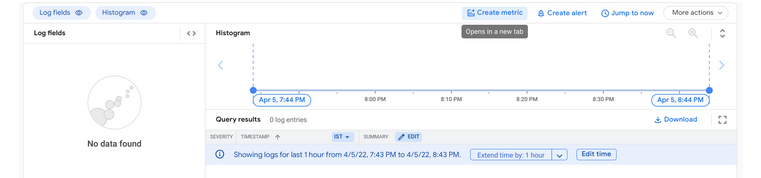
- Click Run Query.
- To create the logs-based metric, click on Create Metric.
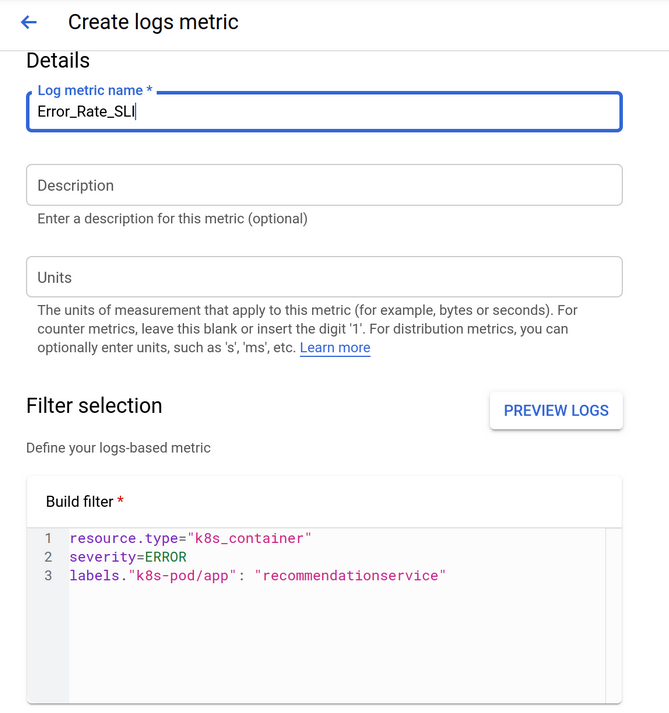
- Name the metric Error_Rate_SLI, and click Create Metric to save the log based metric:
Task 5. Create an alerting policy
- In the Navigation menu, open Monitoring, then click Alerting.
- After the workspace is created, click Create Policy at the top.
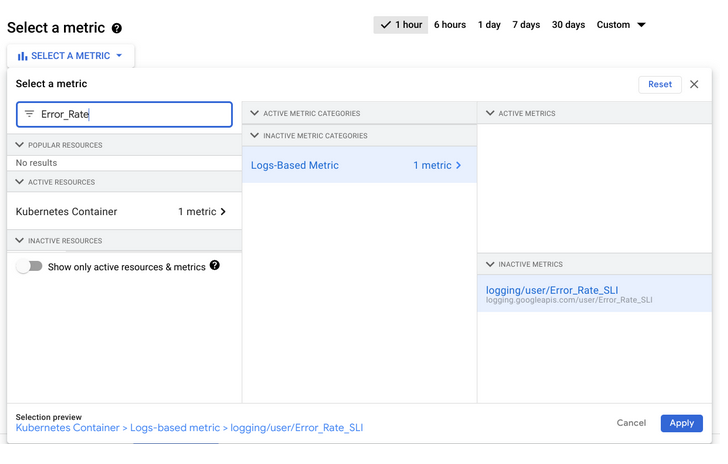
- Click on Select a metric dropdown. Disable the Show only active resources & metrics
- In filter by resource and metric name field, type Error_Rate.
- Click on Kubernetes Container > Logs-Based Metric. Select logging/user/Error_Rate_SLI and click Apply.
- Set Rolling windows function to
Rate. - Click Next.
- Set 0.5 as your Threshold value.
- Click Next again.
- Disable Use notification channel.
- Provide a alert name such as
Error Rate SLIthen click Next. - Review the alert and click Create Policy.
Trigger an application error
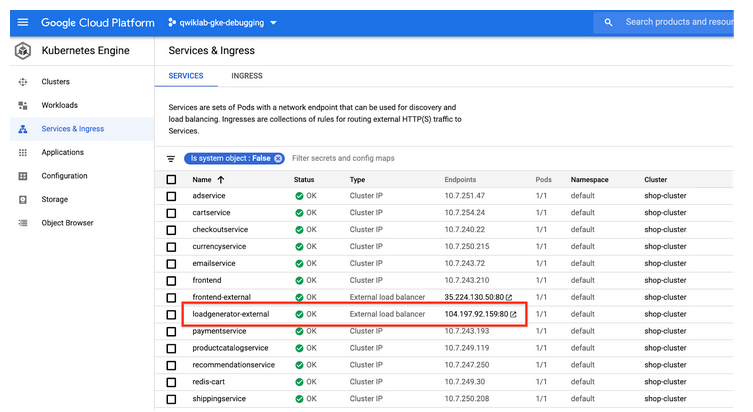
- From the Navigation menu, select Kubernetes Engine, then Service & Ingress.
- Find the
loadgenerator-externalservice, then click on theendpointslink.
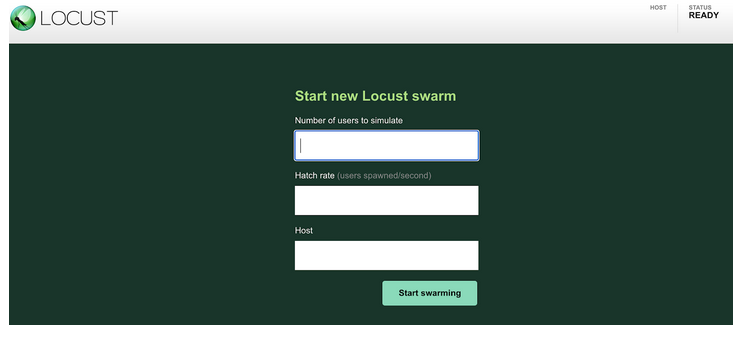
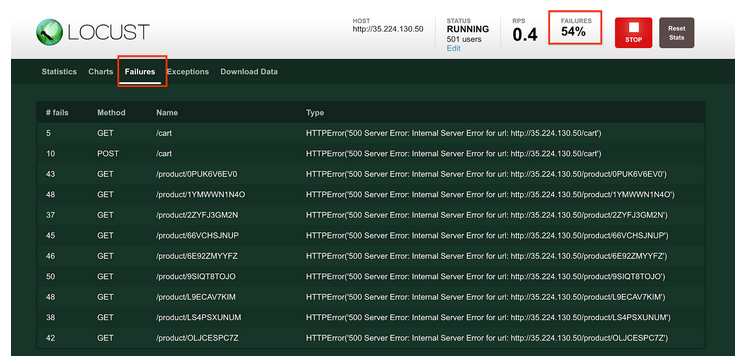
- Simulate 300 users hitting the app with a hatch rate of 30. Locust will add 30 users per second until it reaches 300 users.
- For the host field, you will use the
frontend-external. Copy the URL from the Services & Ingress page; be sure to exclude the port. For example:
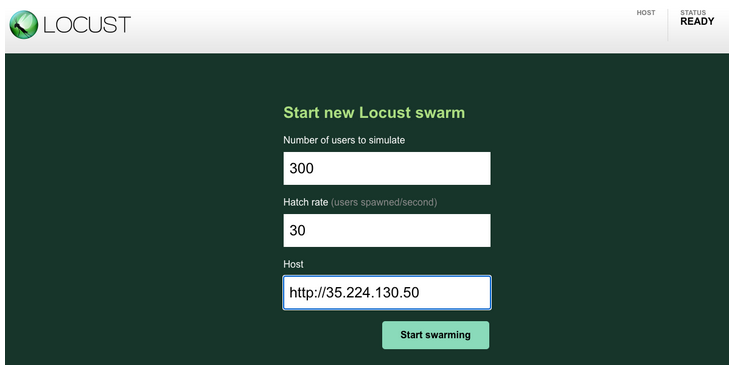
- Click the Start swarming button. You should have about 300 users to hit the predefined URLs in a few seconds.
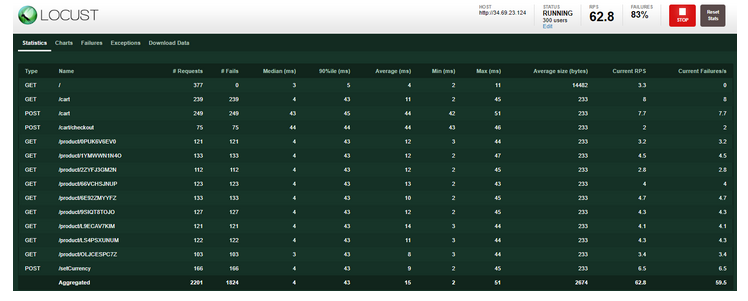
- Click on the Failures tab to see that there are failures starting to occur. You can see there are a large number of 500 errors.
Confirming the alert and application errors
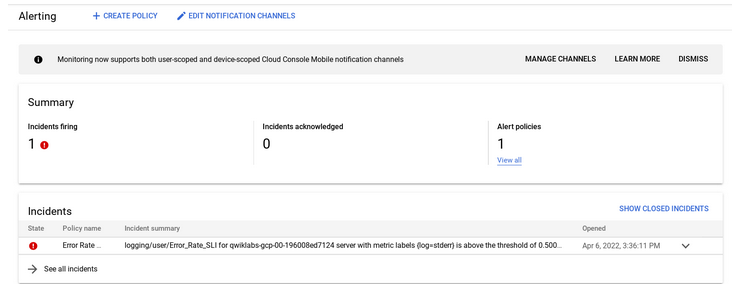
- In the Cloud Console, from the Navigation menu, click Monitoring, then Alerting. You should see an incident soon regarding logging/user/Error_Rate_SLI. If you don’t see an incident right away, wait a minute or two and refresh your page. It can take up to 5 minutes for the alert to fire.
- Click the link of the incident:
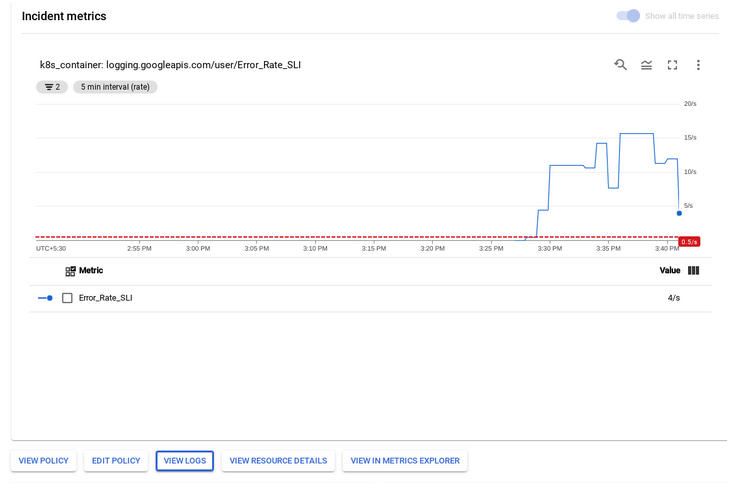
- Click the VIEW LOGS link to view the logs for the pod.
- You can also click the Error label in the Logs field explorer panel to only query the errors.
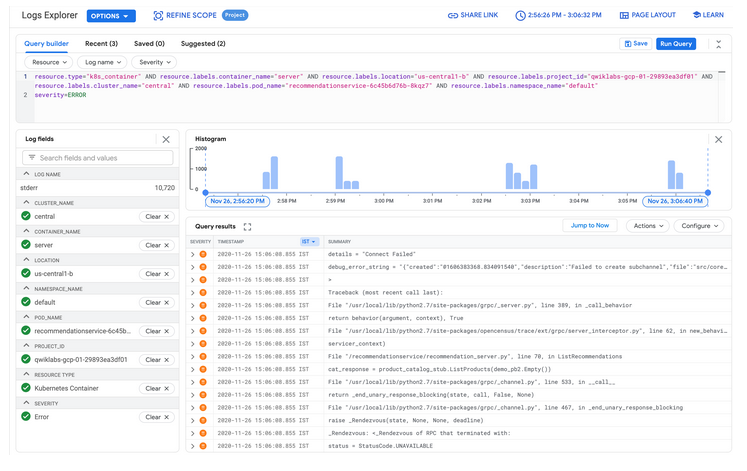
- View the error details by expanding an error event. For example:
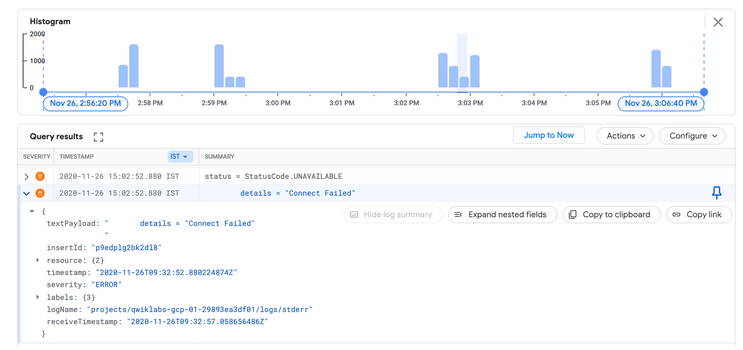
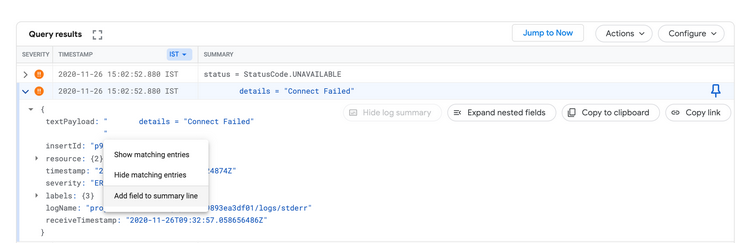
- Expand the
textPayload. - Click the error message and select Add field to summary line to have the error messages appearing as a summary field:
Task 6. Fix the issue and verify the result
- Click the Open Terminal button to return to the Cloud Shell terminal if it has closed.
- Run the following command:
grep -A1 -ni ENABLE_RELOAD release/kubernetes-manifests.yaml
sed -i -e '373,374d' release/kubernetes-manifests.yaml
kubectl apply -f release/kubernetes-manifests.yaml
Penutup
Sahabat Blog Learning & Doing demikianlah penjelasan mengenai Debugging Apps on Google Kubernetes Engine. Semoga Bermanfaat . Sampai ketemu lagi di postingan berikut nya.