Sejak mereka muncul pada tahun 2009, cryptocurrency telah mengalami bagian volatilitasnya — dan merupakan sumber daya tarik yang berkelanjutan. Pada tahun lalu, sebagai bagian dari program Kumpulan Data Publik BigQuery, GoogleCloud merilis kumpulan data yang terdiri dari riwayat transaksi blockchain untuk Bitcoin dan Ethereum, untuk membantu Anda lebih memahami mata uangkripto. Hari ini, kami merilis enam blockchain cryptocurrency tambahan.
Praktikum
Task 1. View the cryptocurrencies in the public dataset
Open Navigation Menu > BigQuery.
The Welcome to BigQuery in the Cloud Console dailog box opens and click DONE.
Click + ADD DATA > Additional sources > Public Datasets.
In Search Marketplace, type bitcoin and press Enter.
Click Bitcoin Cash Cryptocurrency Dataset.
Click VIEW DATASET.
In Type to search, type crypto.
Expand the datasets so you can see they all share the same structure. This makes performing queries across the different cryptocurrencies easy as the tables, views, and fields are identical in each cryptocurrency dataset.
Task 2. Perform a simple query
Change to the Editor tab. Copy and paste this query into the query window and then press Run:
SELECT * FROM `bigquery-public-data.crypto_bitcoin.transactions` as transactions WHERE transactions.hash = 'a1075db55d416d3ca199f55b6084e2115b9345e16c5cf302fc80e9d5fbf5d48d'
Task 3. Validate the data
Double-entry book query of Bitcoin Cash
Copy and paste this query into the query window and then press Run:
-- SQLsource from https://cloud.google.com/blog/products/data-analytics/introducing-six-new-cryptocurrencies-in-bigquery-public-datasets-and-how-to-analyze-them
WITH double_entry_book AS (
-- debits
SELECT
array_to_string(inputs.addresses, ",") as address
, inputs.type
, -inputs.value as value
FROM `bigquery-public-data.crypto_bitcoin.inputs` as inputs
UNION ALL
-- credits
SELECT
array_to_string(outputs.addresses, ",") as address
, outputs.type
, outputs.value as value
FROM `bigquery-public-data.crypto_bitcoin.outputs` as outputs
)
SELECT
address
, type
, sum(value) as balance
FROM double_entry_book
GROUP BY 1,2
ORDER BY balance DESC
LIMIT 100
Verify the Bitcoin values returned are accurate
Copy (Ctrl+C) the top address returned in BigQuery results.
In another browser tab open the websitehttps://www.blockchain.com/explorer/search?search= It will say Oops! – this is ok.
Paste (Ctrl+V) the address into the search box and click Search.
Check the final balance returned (in BTC) – it should be the same as the balance listed in BigQuery results for that address.
Copy the top address returned in BigQuery results.
In another browser tab open the website https://dogechain.info/.
Paste into the search box and click search.
Note the balance returned, it should be the same as the balance listed in BigQuery results for that address.
Task 4. Plot the Gini coefficient for cryptocurrency
Create the query
Copy and paste this query into the query window and then press Run:
-- SQL source from https://gist.github.com/allenday/1500cc268f24ae89b7adfc25c74967b0
WITH double_entry_book AS (
    -- debits
    SELECT
     array_to_string(inputs.addresses, ",") as address
    , inputs.type
    , -inputs.value as value
    , block_timestamp
    FROM `bigquery-public-data.crypto_dash.inputs` as inputs
    UNION ALL
    -- credits
    SELECT
     array_to_string(outputs.addresses, ",") as address
    , outputs.type
    , outputs.value as value
    , block_timestamp
    FROM `bigquery-public-data.crypto_dash.outputs` as outputs
)
,double_entry_book_by_date as (
    select
        date(block_timestamp) as date,
        address,
        sum(value / POWER(10,0)) as value
    from double_entry_book
    group by address, date
)
,daily_balances_with_gaps as (
    select
        address,
        date,
        sum(value) over (partition by address order by date) as balance,
        lead(date, 1, current_date()) over (partition by address order by date) as next_date
        from double_entry_book_by_date
)
,calendar as (
    select date from unnest(generate_date_array('2009-01-12', current_date())) as date
)
,daily_balances as (
    select address, calendar.date, balance
    from daily_balances_with_gaps
    join calendar on daily_balances_with_gaps.date <= calendar.date and calendar.date < daily_balances_with_gaps.next_date
)
,supply as (
    select
        date,
        sum(balance) as daily_supply
    from daily_balances
    group by date
)
,ranked_daily_balances as (
    select
        daily_balances.date,
        balance,
        row_number() over (partition by daily_balances.date order by balance desc) as rank
    from daily_balances
    join supply on daily_balances.date = supply.date
    where safe_divide(balance, daily_supply) >= 0.0001
    ORDER BY safe_divide(balance, daily_supply) DESC
)
select
    date,
    -- (1 − 2B) https://en.wikipedia.org/wiki/Gini_coefficient
    1 - 2 * sum((balance * (rank - 1) + balance / 2)) / count(*) / sum(balance) as gini
from ranked_daily_balances
group by date
order by date asc
In the Query Results ribbon, click Save Results and select BigQuery table
In the Export to BigQuery Table, leave the project as is, select the lab dataset and give it a name, such as dash_gini. Press Export. After it finishes, click Go To Table.
Use Looker Studio to visualize the query
In the Table view, click Export and select Export with Looker Studio. Then click Authorize in the Requesting Authorization prompt.
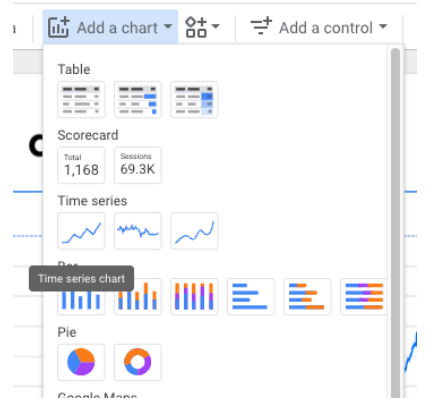
When Looker Studio comes up, delete the automatically generated charts (select them and press the Delete key). Click on Add a chart and select Time Series. Click Time Series Chart.
Change the metric to gini.
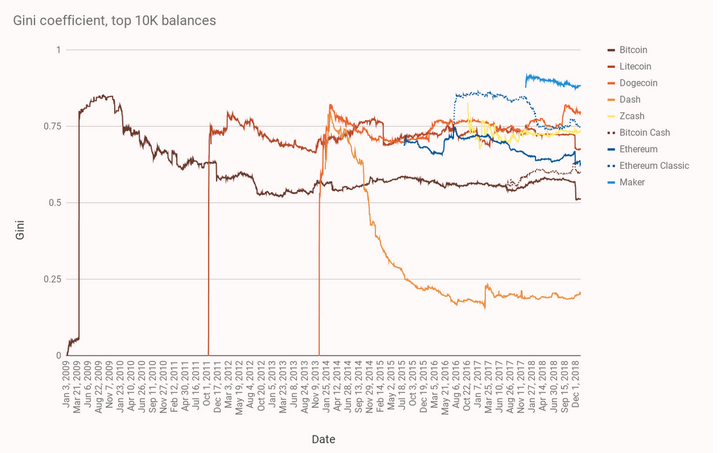
Compare the graph with the original source article graph (reproduced below). In the chart below you are looking for the brown line. Starting in December 2019, see how it’s changed since then.
Task 5. Explore two famous cryptocurrency events
CREATE OR REPLACE TABLE lab.51 (transaction_hash STRING) as
SELECT -- write the rest of the select statement (remember to use where) ...
CREATE OR REPLACE TABLE lab.52 (balance NUMERIC) as
WITH double_entry_book AS (
   -- debits
   SELECT
    array_to_string(inputs.addresses, ",") as address
   , -inputs.value as value
   FROM `bigquery-public-data.crypto_bitcoin.inputs` as inputs
   UNION ALL
   -- credits
   SELECT
    array_to_string(outputs.addresses, ",") as address
   , outputs.value as value
   FROM `bigquery-public-data.crypto_bitcoin.outputs` as outputs
)
SELECT -- write the rest of the select statement (remember to use where) ...
Penutup
Sahabat Blog Learning & Doing demikianlah penjelasan mengenai Exploring the Public Cryptocurrency Datasets Available in BigQuery. Semoga Bermanfaat . Sampai ketemu lagi di postingan berikut nya.


 Token")