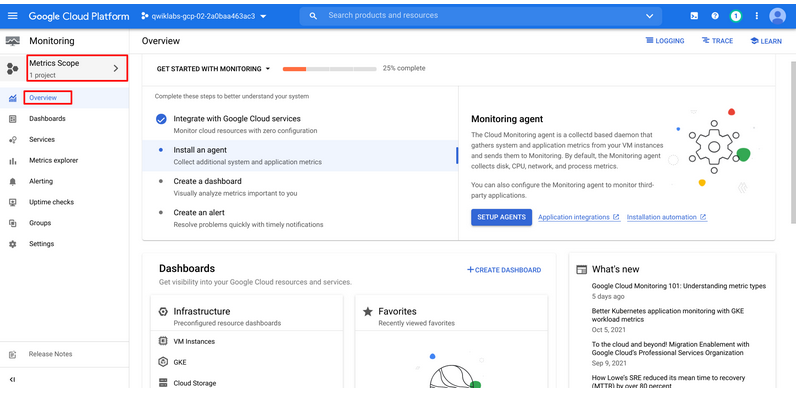
Cloud Monitoring memberikan visibilitas ke kinerja, waktu aktif, dan kesehatan aplikasi yang didukung cloud secara keseluruhan. Cloud Monitoring mengumpulkan metrik, peristiwa, dan metadata dari Google Cloud, Amazon Web Services, probe uptime yang dihosting, instrumentasi aplikasi, dan berbagai komponen aplikasi umum termasuk Cassandra, Nginx, Server Web Apache, Elasticsearch, dan banyak lainnya. Cloud Monitoring menyerap data tersebut dan menghasilkan wawasan melalui dasbor, diagram, dan peringatan. Peringatan Cloud Monitoring membantu Anda berkolaborasi dengan berintegrasi dengan Slack, PagerDuty, HipChat, Campfire, dan banyak lagi.
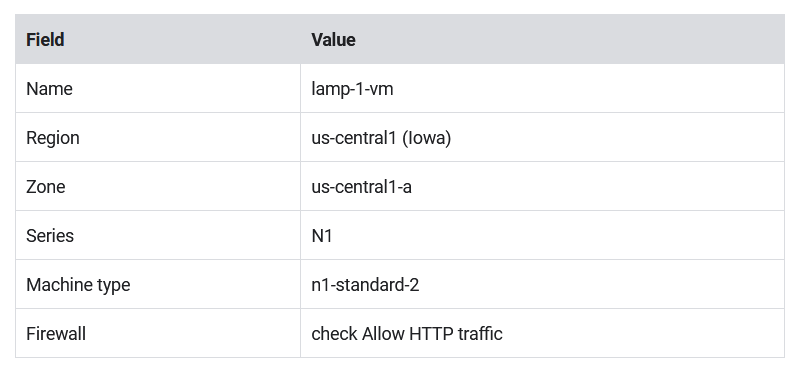
Buat Compute Engine instance
Buka Navigation menu > Compute Engine > VM instances, then click Create instance.
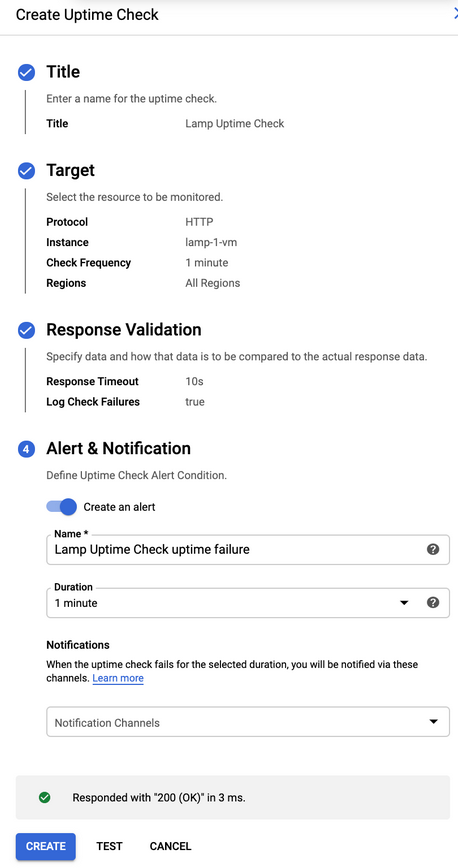
Title: Lamp Uptime Check, then click Next.

Protocol: HTTP

Resource Type: Instance

Applies to: Single, lamp-1-vm

Path: leave at default

Check Frequency: 1 min
Klik Test -> Create
Buat alerting policy
In the left menu, click Alerting, and then click Create Policy.
Click Add Condition. Isi field
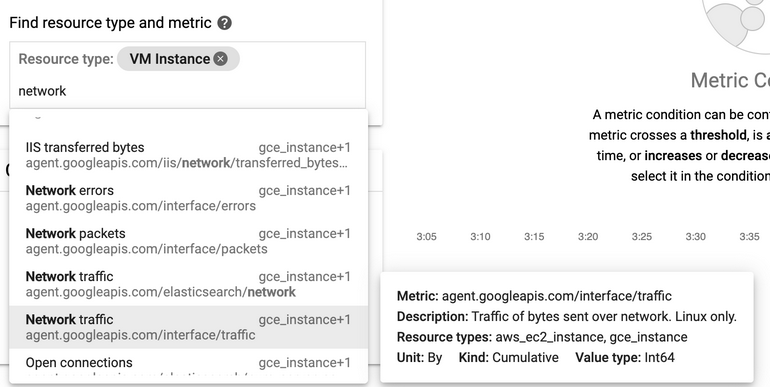
Resource Type: VM Instance (gce_instance)

Metric: Type "network", and then select Network traffic (gce_instance+1). Be sure to choose the Network traffic resource with agent.googleapis.com/interface/traffic:
Configuration
Condition: is above
Threshold: 500
For: 1 minute
Click ADD.
Click on Next.
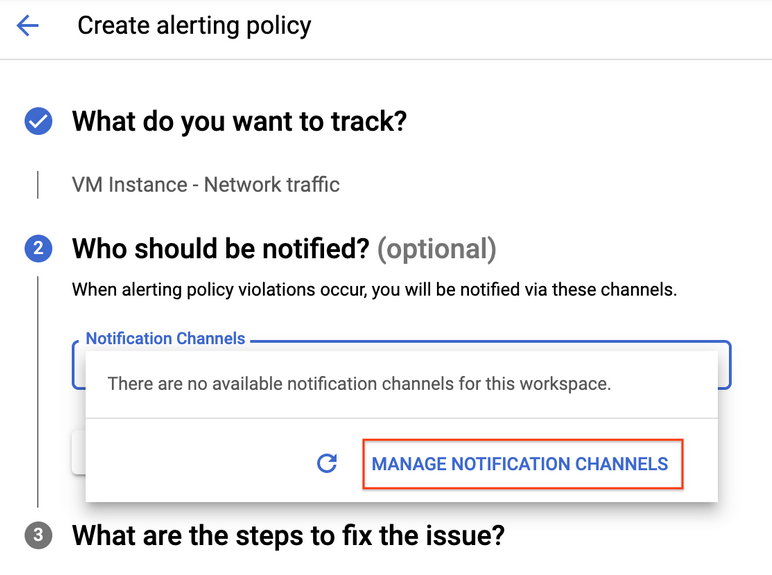
Click on drop down arrow next to Notification Channels, then click on Manage Notification Channels.
5. Scroll down the page and click on ADD NEW for Email.
In Create Email Channel dialog box, enter your personal email address in the Email Address field and a Display name.
Click on Save.
Go back to the previous Create alerting policy tab.
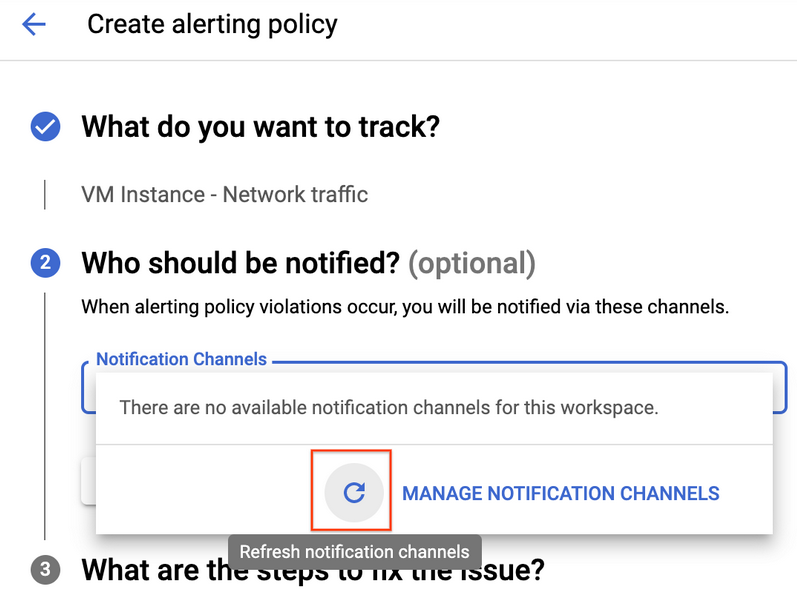
Click on Notification Channels again, then click on the Refresh icon to get the display name you mentioned in the previous step.
Now, select your Display name and click OK.
Click Next.
Mention the Alert name as Inbound Traffic Alert.
Add a message in documentation, which will be included in the emailed alert.
Click on Save.
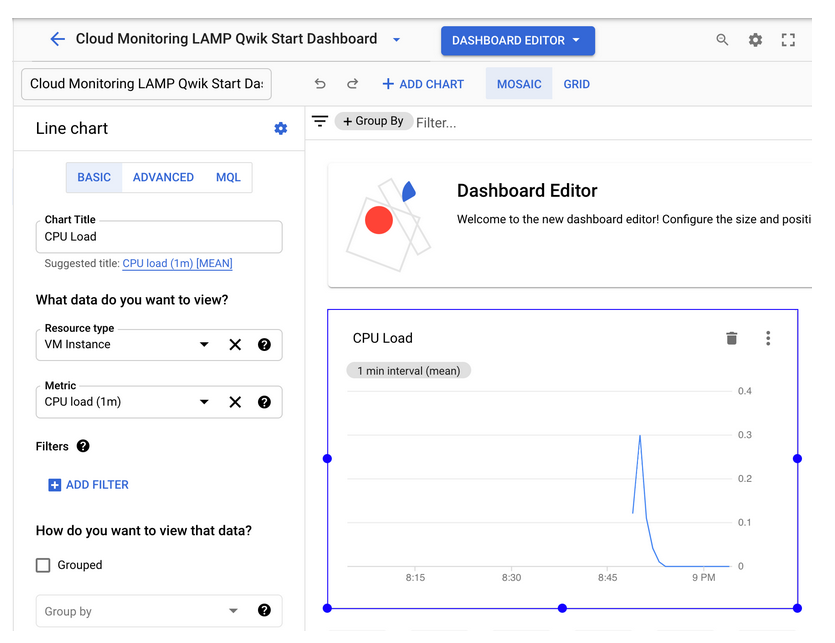
Create a dashboard and chart
In the left menu select Dashboards, and then Create Dashboard.
Name the dashboard Cloud Monitoring LAMP Qwik Start Dashboard.
Set the Metric CPU load (1m) (You may need to uncheck the only show active box). Refresh the tab to view the graph.
Add the second chart
Click + Add Chart and select Line option in Chart library.
Name this chart Received Packets.
Set the resource type to VM Instance.
Set the Metric Received packets (gce_instance). Refresh the tab to view the graph.
Leave the other fields at their default values. You see the chart data.
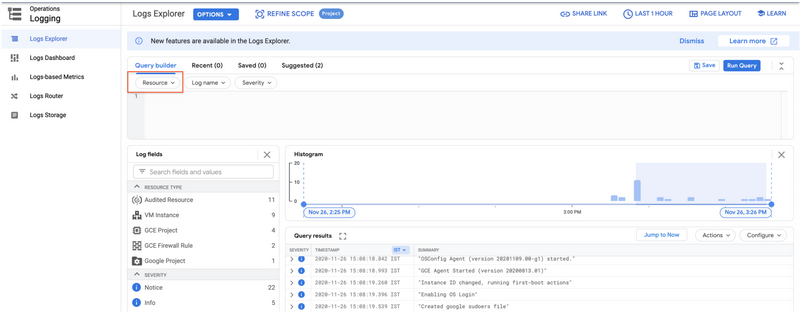
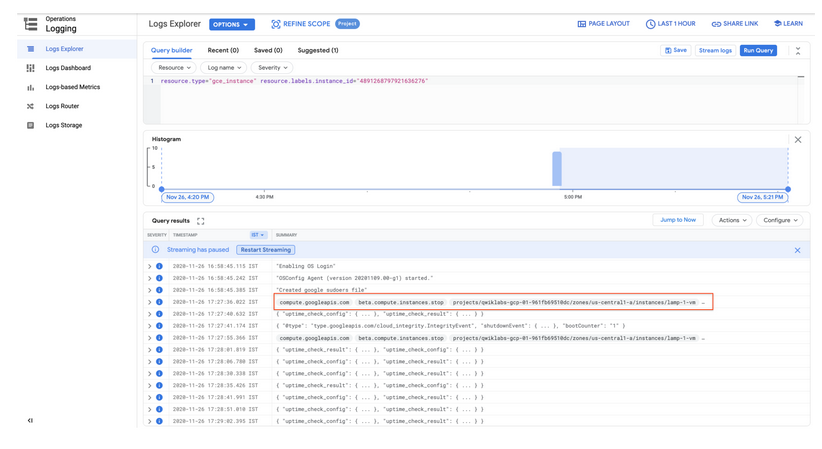
View your logs
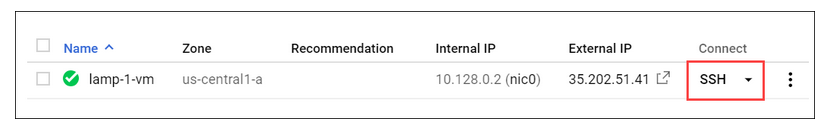
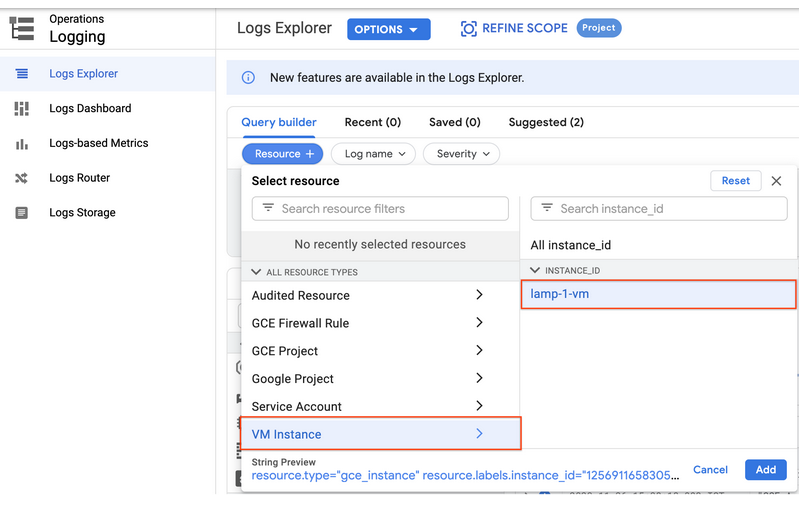
Select Navigation menu > Logging > Logs Explorer.
Select the logs you want to see, in this case, you select the logs for the lamp-1-vm instance you created at the start of this lab:
Click on Resource.
Select VM Instance > lamp-1-vm in the Resource drop-down menu.
Click Add.
Leave the other fields with their default values.
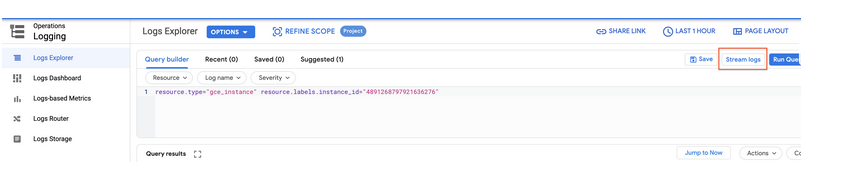
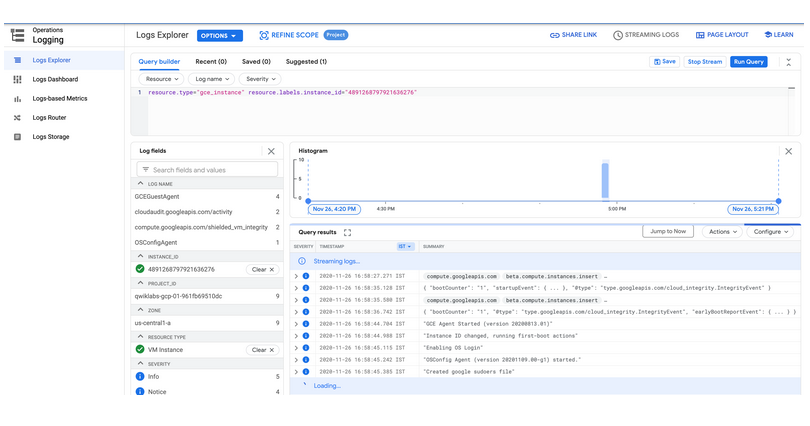
Click the Stream logs.
Check out what happens when you start and stop the VM instance.
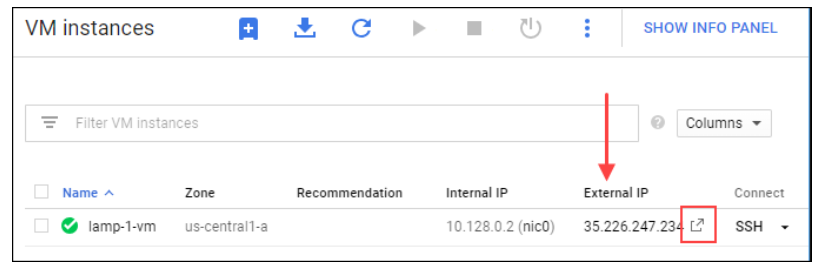
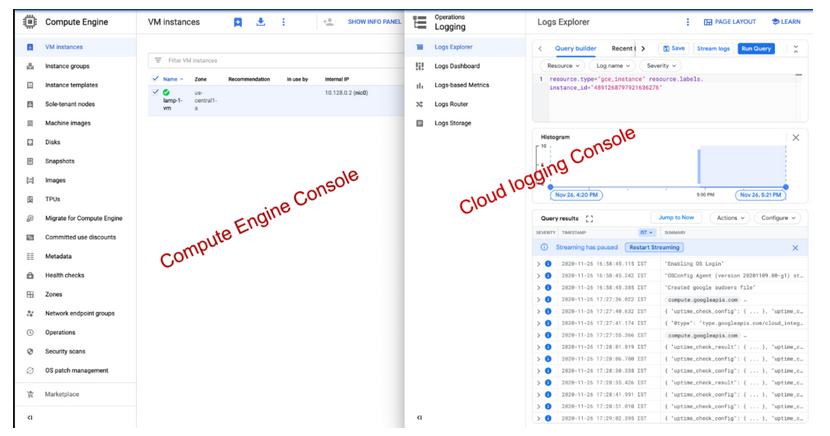
Open the Compute Engine window in a new browser window. Select Navigation menu > Compute Engine, right-click VM instances > Open link in new window.
Move the Logs Viewer browser window next to the Compute Engine window. This makes it easier to view how changes to the VM are reflected in the logs.
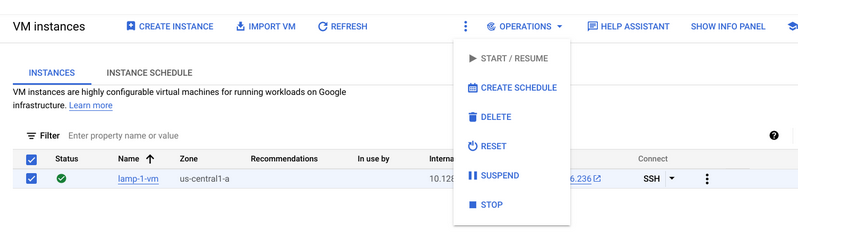
In the Compute Engine window, select the lamp-1-vm instance, click the three vertical dots at the top of the screen and then click Stop, and then confirm to stop the instance.
It takes a few minutes for the instance to stop.
Watch in the Logs View tab for when the VM is stopped.
Penutup
Sahabat Blog Learning & Doing demikianlah penjelasan mengenai Cloud Monitoring. Semoga Bermanfaat . Sampai ketemu lagi di postingan berikut nya.


")


")