“Monitoring Multiple Projects with Cloud Monitoring”
Daftar Isi
Pengantar
Cloud Monitoring menyediakan dasbor dan peringatan sehingga Anda dapat meninjau metrik performa untuk layanan cloud, mesin virtual, dan server sumber terbuka umum seperti MongoDB, Apache, Nginx, Elasticsearch, dan lainnya. Anda mengonfigurasi Cloud Monitoring di Konsol.
Praktikum
Task 1. Create Project 2’s virtual machine
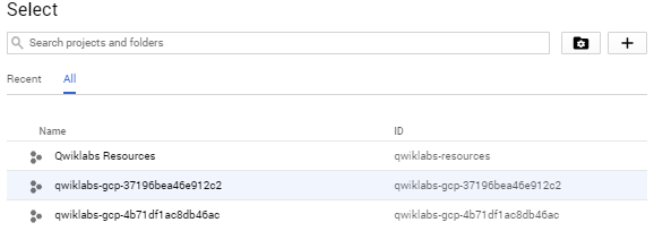
- At the top of the screen, click on the dropdown arrow next to Project 1’s name.

- Make sure that you’re on the All tab, then click on the name of Project 2 to go into it.
- Select Navigation menu > Compute Engine to open the VM instances window.
- Click +Create instance to create a new instance.
- Name this instance instance2.
- Select
RegionandZone - Click Create.
Create a Monitoring Metrics Scope
- click Navigation menu Navigation menu icon > Monitoring.
- In the left panel, click Settings and then in the Settings window, click +Add GCP PROJECTS in the GCP Projects section.
- Select Project ID 1.
- Under Select scoping project, select Use this project as the scoping project.
- Click Add projects then click Confirm.
Task 2. Monitoring Overview
Create a Cloud Monitoring group
- In the left menu, click Groups, then click +Create group.
- Name your group DemoGroup.
- In the first dropdown field (Type), Name is selected by default.
- In the second dropdown (Operator), Contains is selected by default.
- In the third field (Value), type in “instance” since both of the instance names in both of your projects start with the word
instance. - Click Done, then click Create.
Task 3. Uptime check for your group
- In the left menu, click Uptime checks, then click +Create uptime check.
- Create your uptime check with the following information:
Title: DemoGroup uptime check, then click Next.

Protocol: TCP

Resource Type: Instance

Applies To: Group, and then select DemoGroup.

Port: 22

Check frequency: 1 minute, then click Next.- Click Next again.
- Put the slider in off state for Create an alert option in Alert & notification section.
- Click TEST to verify that your uptime check can connect to the resource.
- When you see a green check mark everything can connect, click Create.
Task 4. Alerting policy for the group
- In the left menu, click Uptime checks.
- Click the three dots
at the far right of your Display Name and click Add alert policy.
- Click +Add alert condition.
- Select the previously created Uptime health check on DemoGroup condition and click Delete alert condition.
- In your New condition, click Select a metric.
- Turn off the Show only active resources & metrics toggle.
- In the Select a metric field, search
check_passedand click VM Instance > Uptime_check > Check passed. Click Apply. - Click Add filter, set the
Filterto check_id and select demogroup-uptime-check as theValue. Click Done, then click Next. - Select Metric absence as Condition type and click Next.
- Turn off Configure notifications.
- In the Alert policy name field, enter the Name as Uptime Check Policy. Click Next.
- Click Create policy.
Task 5. Custom dashboard for your group
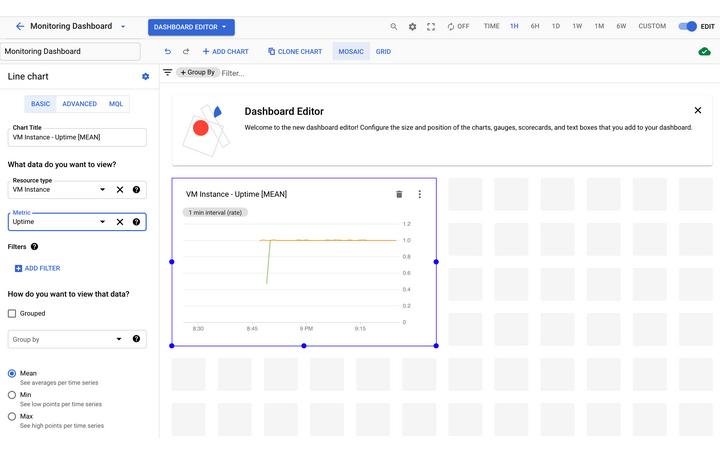
- In the left menu, click Dashboards, then click +Create dashboard.
- Name your dashboard.
- Click the Line option in
Chart libraryto add the first chart. - Leave the Chart Title as default.
- In the Resource & Metric field, search uptime (compute.googleapis.com/instance/uptime) and click VM Instance > Instance > Uptime. Click Apply.
Task 6. Remove one instance to cause a problem
- In the console, select Navigation menu > Compute Engine.
- Check the box next to instance2, then click on the 3 vertical dots
at the top of the page and click Stop. Click Stop again to turn off the machine.
- Wait a minute or 2 for the instance to stop and violate the uptime check you just set up. After a couple of minutes, turn your machine back on by clicking Start/Resume, then Start.
- Click Navigation menu > Monitoring > Alerting and refresh your browser. It may take a few more minutes to show that you have issues in the Summary section. Refresh until you see an Incident similar to this:

Incidents
- In the Incidents section, click on the name of the alerting policy that was violated to go into it.
- You’ve already fixed your problem by turning the VM back on, so the incident was cleared and you no longer see an incident in the Incidents section.
- To see the cleared incident, scroll down and click on the Show closed incidents link.
- Your incident should have a Closed status. You can read through the incident details.
- You can also click on the Uptime Check Policy link to explore the metrics it gives you.
Penutup
Sahabat Blog Learning & Doing demikianlah penjelasan mengenai Monitoring Multiple Projects with Cloud Monitoring. Semoga Bermanfaat . Sampai ketemu lagi di postingan berikut nya.
(Visited 182 times, 1 visits today)

